Build a campaign with clear actions and practical help.
This review brings together research on safety messages, riding education, and support.
Start with eight practical steps, then explore the examples and evidence.
For community advocates, local groups, and anyone making a safety campaign: give people one
clear action and a practical way to take it. Start with these steps from the two-page guide.
01
Pick one audience and one moment
Choose one audience and road situation, such as drivers passing on a narrow street.
02
Say exactly what to do
Say who should act, when, and what to do. Make this the main headline.
03
Show the action in the picture
Help readers see the safe choice. Keep any portrait or story beside a clear instruction.
04
Pair advice with practical help
Offer real help: lights and fitting, supervised practice, or a clear place to get support.
05
Reach people in familiar places
Use familiar places, useful languages, and formats chosen with the people you want to reach.
06
Ask people before you print a large batch
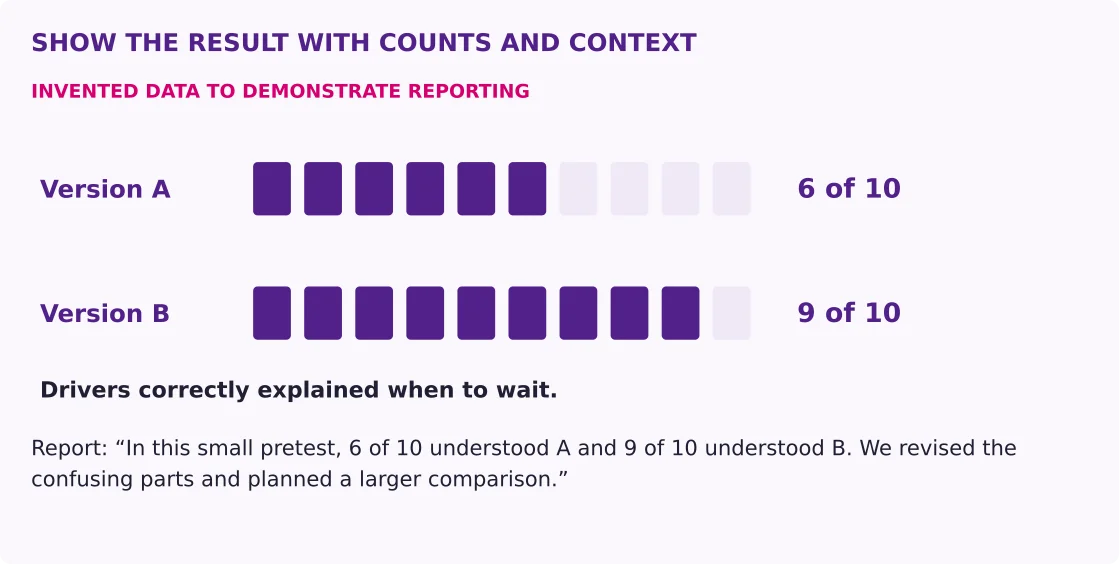
Ask readers to explain the action before you explain it. Revise confusing or blaming messages.
07
Check the finished piece
Review local rules, print at actual size, check translations, and test the QR code and short web address.
08
Check what people learn and use
Track who you reach, what readers understand, and whether people use the action. Use the results to improve.
EXAMPLE / A DRIVER PASSING A RIDER
“No safe room to pass? Slow down and wait behind.”
Show a driver waiting behind the rider. Ask a few drivers to explain when to wait before
you print a large batch.
Search the complete review, all 68 sources and the visual explanations.
THE ENCOUNTER LAB ✳
See the decision in the street.
Choose a situation, change the scene, and notice who needs to act next.
ROAD SCENE / PASSING
Illustrative road scene. Check local rules and actual road layout.
THE DECISION ✳
Room to pass?
WHAT HAPPENS NEXTDriver: slow down and wait behind the rider.
There is not a clear opportunity to pass in this scene.
CHANGE THE SCENE
MESSAGE WORKBENCH ✳
Make the action impossible to miss.
Build a draft for one audience and one moment. Then put it in front of real readers.
01 / YOUR BRIEF
02 / POSTER PREVIEWDRAFT
3 FEET PLEASE✳
Passing / Drivers
No safe room? Slow down. Wait behind.
No safe room to pass? Slow down and wait behind.
A draft to adapt and test with your audience.
BEFORE YOU SHARE
Check it in the real world.
This brief stays on this device until you ask the assistant.
Examples and campaign materials
See the ideas in action.
Explore the report’s draft examples and the current campaign library. Poster A and B pages are
alternatives; card pages may form duplex pairs. Page numbers identify each proof without
assuming every page is a front or back.
FREE CAMPAIGN LIBRARY
Take an idea. Make it your own.
Download a PDF to print, or open a Canva template to create your own editable copy. No email
or form required for downloads.
Canva sign-in is required to make a copy. Editable PowerPoint files are available too.
31
results
Figure 1
Rewrite the prompt.
Figure 2
Match support to the barrier.
Figure 3
Show why waiting is the right choice.
Print example 1
Make waiting the obvious next step.
Figure 4
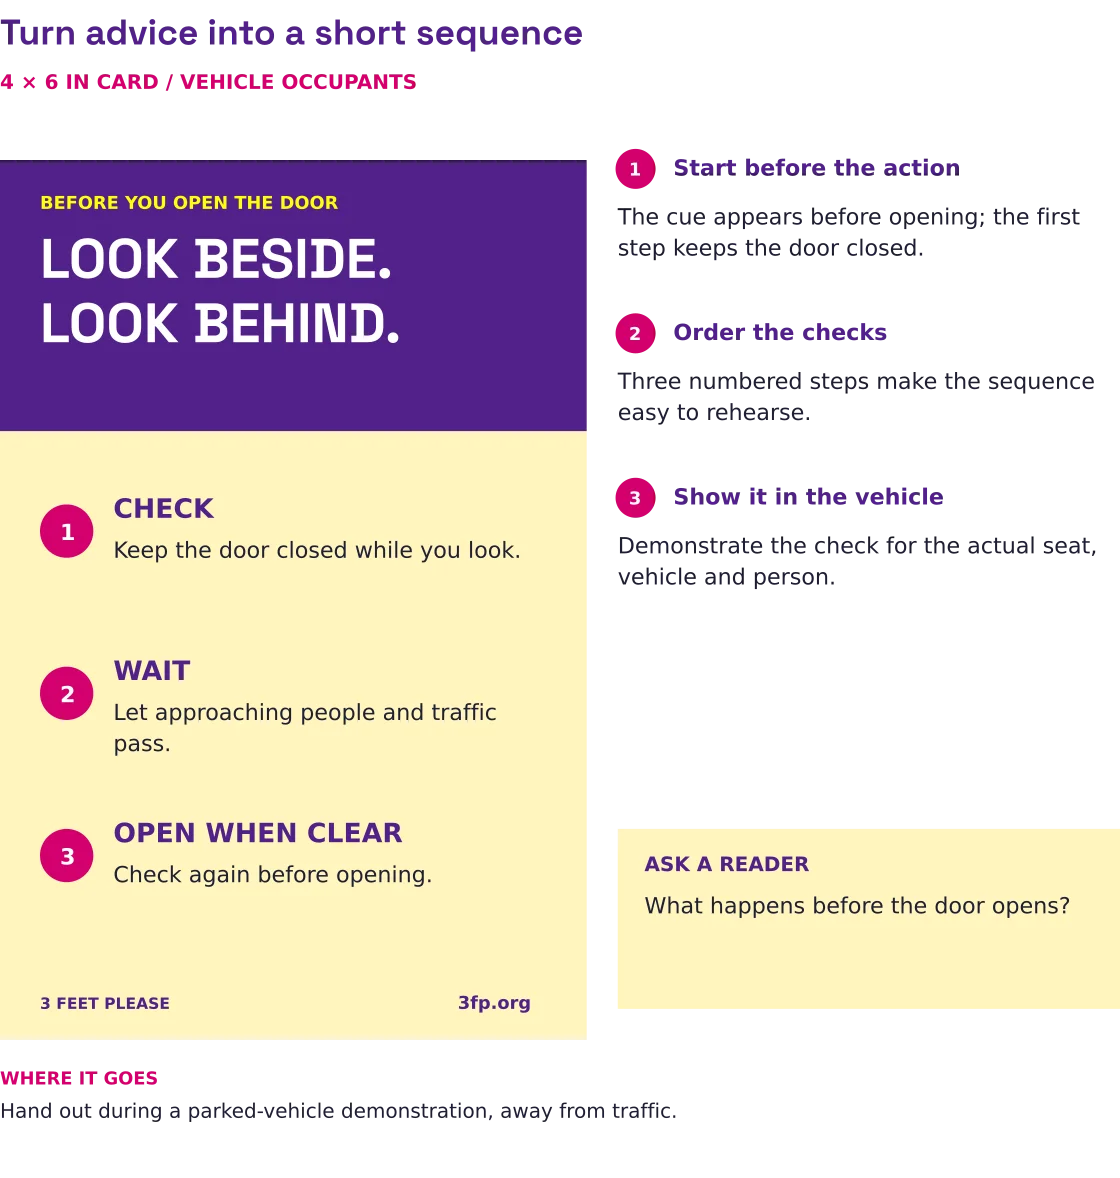
Make the door check a sequence.
Print example 2
Turn advice into a short sequence.
Figure 5
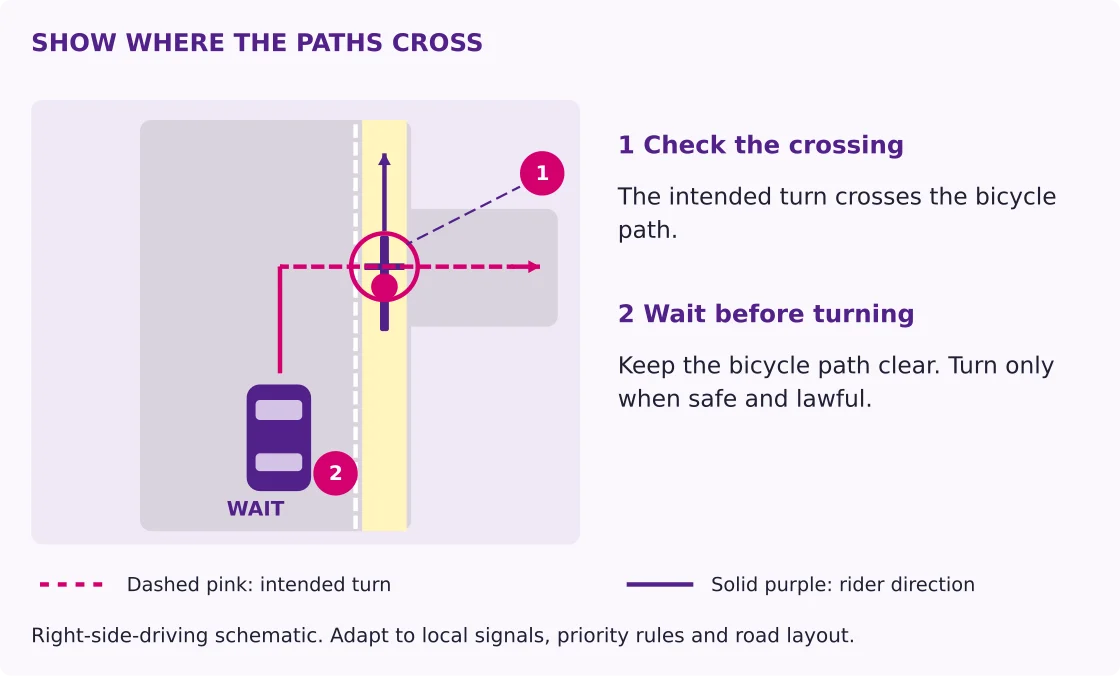
Show the turning driver waiting.
Print example 3
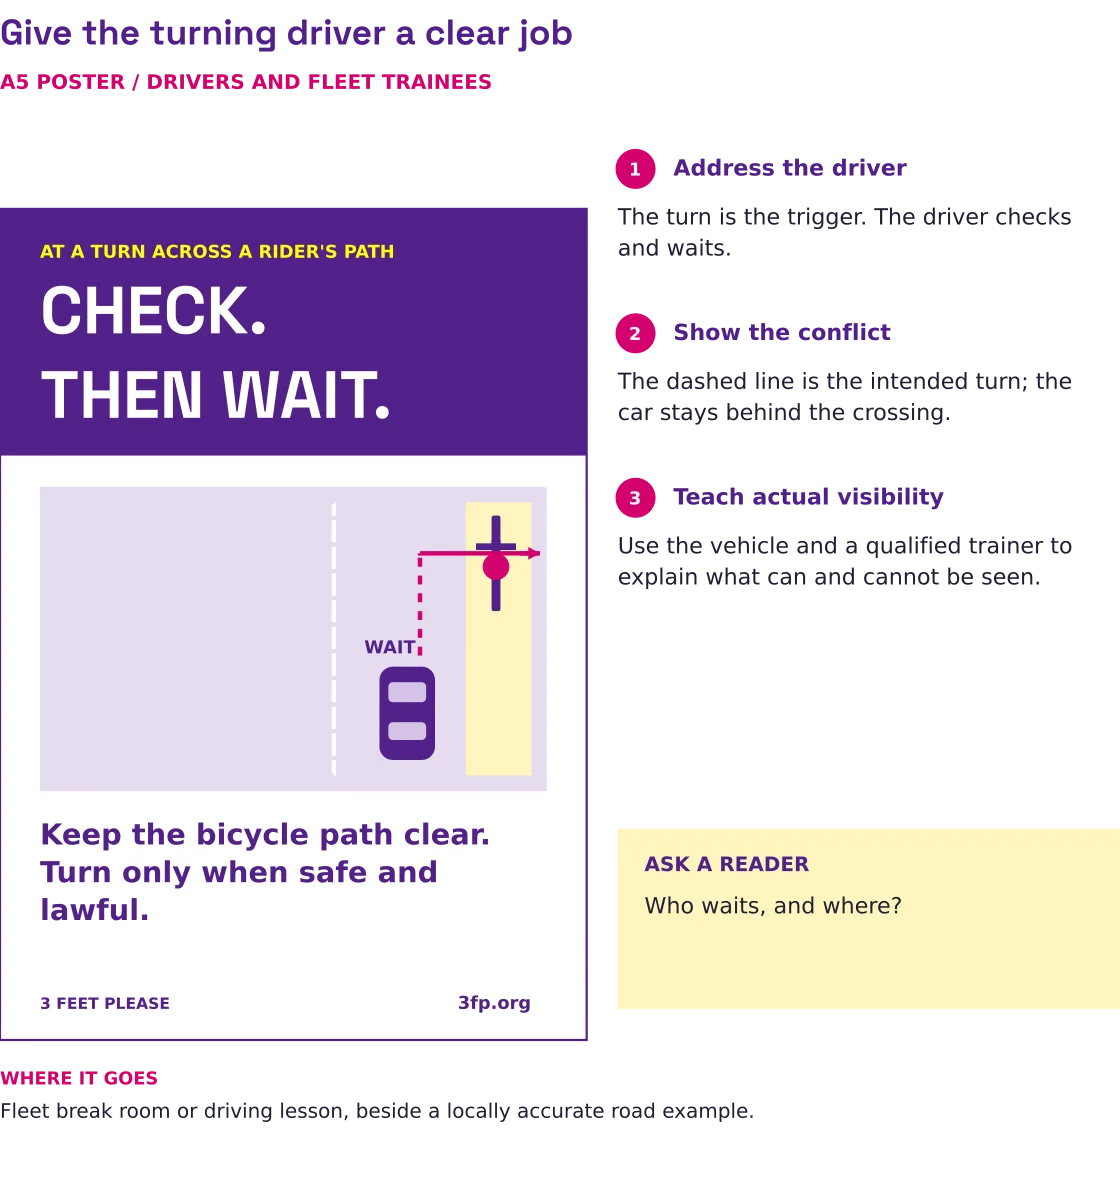
Give the turning driver a clear job.
Figure 6
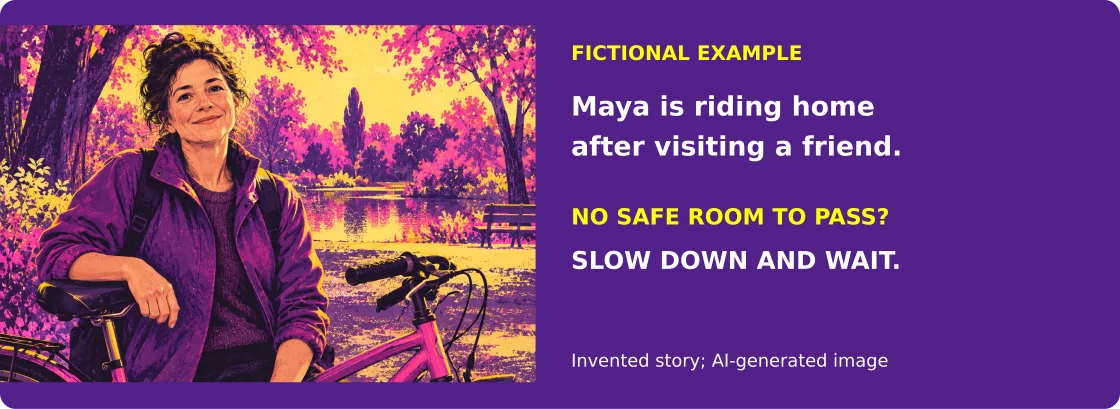
Pair a backstory with the driver action.
Figure 7
Check whether the response lasts.
Figure 8
Vary the story, keep the safe action.
Print example 4
Pair a human connection with a safe action.
The evidence register
Find the study behind the claim.
Search by study ID, topic, author, or outcome. Filters group records by words in their methods
and measured endpoints; studies can appear in more than one group.
R01Overview and Outcomes of Victoria’s Passing Distance Cycling Safety Public Education CampaignMcIntyre, A.; Sinclair, J.; Page-Smith, J.; Ziekemijjer, P.; Ellis, N. · 2019+
What was measured
Instrumented passing distance and close-pass rates; survey-reported awareness, understanding, and support for passing-distance rules.
What the study found
Regression modeling on matched cyclists and locations reported a significantly lower 1.99% rate of close passing after the campaign. The report does not specify whether 1.99% is relative or percentage-point change. Survey changes in support/understanding were small and several returned toward baseline by March.
Limits
Extended abstract omits close-pass definition, regression specification, standard error, and confidence interval; no untreated comparison; unmatched seasonal windows; only 18 repeat cyclists; no crash endpoint. Do not convert 1.99% or attribute it to a specific ad.
Study design
Public education campaign with repeated cross-sectional surveys and a naturalistic PassBox before/after passing-distance sample in Melbourne.
R02Effects of Bicycles May Use Full Lane Signs on Bicyclist and Motorist Behavior along Multi-Lane FacilitiesMills, A.; Loskorn, J.; Brady, J.; Duthie, J.; Machemehl, R. · 2010+
What was measured
Observed vehicle–bicycle passing distance, lane changes and encroachment; cyclist lane and sidewalk use.
What the study found
At Lamar, measured space among passes without a lane change increased; the share within 3 ft fell from 44% to 0%. Adjacent-lane encroachment increased from 77% to 97% (p=.030). At Pleasant Valley, cyclist use of the full lane decreased and sidewalk/avoidance behavior increased, but passing data were too sparse for a stable estimate.
Limits
Small, uncontrolled before/after study; a passing ordinance was adopted during the study period; report did not record whether adjacent lanes were occupied; event table includes an internal arithmetic inconsistency; no crash endpoint.
Study design
Traffic-camera before/after observations at two Austin multi-lane road sites after BMUFL sign installation.
Sample
passing events: At Lamar Boulevard the table lists 61 before and 45 after passing events; the same row's total is arithmetically inconsistent. Pleasant Valley had too few post-installation passing events for a useful analysis.; unit: vehicle-bicycle events at two sites
No message-type effect on intention (F(2,130)=1.02, p=.365). Message effectiveness had an omnibus difference (F(2,130)=4.64, p=.011), but no pairwise differences survived Bonferroni adjustment. Twelve of 52 respondents (23%) interpreted the descriptive-norm message in the opposite direction.
Limits
Smartphone use rather than cyclist passing; immediate self-report, no no-message control and no observed driving behavior. The sample was predominantly female; comprehension result should not be generalized as proof of cycling-message failure.
Study design
Online survey experiment randomly assigning young drivers to descriptive-, subjective-, or injunctive-norm messages.
Sample
136 young New South Wales drivers; 92 women and 44 men.
R04Increasing child pedestrian and cyclist visibility: cluster randomised controlled trialMulvaney, C. A.; Kendrick, D.; Watson, M. C.; Coupland, C. A. C. · 2006+
What was measured
Observed use of fluorescent or reflective visibility aids by child pedestrians and cyclists.
What the study found
Observed use of any visibility aid was higher in the intervention arm at one week (adjusted OR 59.5, 95% CI 18.5–191.0) and eight weeks (adjusted OR 5.9, 95% CI 3.4–10.4).
Limits
Equipment and education bundled; wide one-week CI; short winter follow-up; mixed pedestrian/cyclist sample; no collision or injury outcome and no isolated leaflet effect.
Study design
Cluster-randomized trial; free reflective/fluorescent slap wrap and reflective sticker plus educational material versus control; observers recorded use at baseline, one week and eight weeks.
Sample
377 children aged 7–9 from 20 Nottingham school classes; pedestrian and cyclist visibility behaviors combined.
R05Research into the impact of Bikeability training on children's ability to perceive and appropriately respond to hazards when cycling on the roadHodgson, C.; Worth, J. · 2015+
What was measured
Screen-based hazard-perception and response quiz scores; practical cycling-assessment scores and reported cycling frequency.
What the study found
Reported quiz effect sizes were 1.58 at phase 2 and 1.60 at phase 3; no confidence intervals were reported for these estimates. The quiz difference persisted more than two months. In the trained-only practical cohort, the mean score fell by 1.6 points from phase 2 to phase 3. Pupils reported no increase in cycling frequency.
Limits
School access/training not randomized. Quiz is knowledge/performance in a screen-based task; no injury endpoint. Practical assessment had no comparison group and smaller follow-up sample; the decline is not a controlled estimate of retention.
Study design
Non-randomized comparison of trained and comparison pupils, repeated on-screen hazard-perception/response quiz and a separate practical assessment of trained pupils only.
Sample
29 schools in the overall evaluation. Quiz phase 2: 66 trained and 76 comparison pupils; phase 3: 101 trained and 53 comparison pupils. Practical assessment: 75 trained pupils at phase 2 and 64 at phase 3, from six schools.
R06Reducing Car Dooring: The role of stickers as visual remindersConcepts of Change; Ipsos Social Research · 2013+
What was measured
Participants’ reported perceptions of dooring and stickers, recall and use of the sticker, and responses to prompts.
What the study found
Of 11 sticker recipients interviewed at follow-up, four initially did not recall receiving a sticker and one reported using it. Participants said stickers could fade into the background and were unlikely to work alone; face-to-face questions appeared to alert people to the issue.
Limits
Qualitative and self-selected sample; four groups and small follow-up; no randomized causal estimate, observed door-opening behavior, or dooring/crash outcome.
Study design
Qualitative street recruitment, four focus groups comparing sticker and conversation prompts, and four in-depth interviews.
R07Improving attitudes towards vulnerable road usersCrundall, D.; van Loon, E. · 2023+
What was measured
Explicit and implicit attitudes toward cyclists and horse riders; stated passing distance and speed.
What the study found
Explicit attitudes improved toward the road-user represented in the video; intended passing distance increased and intended passing speed decreased. No implicit-attitude effect was found. Changes were specific to the target shown; cyclist videos did not improve attitudes toward horse riders and horse videos did not improve attitudes toward cyclists.
Limits
Immediate self-reported and image-slider outcomes only; no actual driving or crash outcomes; online sample with positive baseline attitudes; potential ceiling effects and reactance/blame in some comments.
Study design
Randomized online video intervention with cyclist- and horse-focused personal stories and an unrelated road-safety video control; pre/post attitude and stated passing-distance/speed questions.
Sample
total: 344; population: UK drivers age 18-78; unit: survey participants
R08Revisiting attitude change sixteen months after vulnerable road user empathy videos: Look Out For Laura follow-up evaluationCrundall, D.; van Loon, E. · 2023+
What was measured
Follow-up explicit attitudes toward cyclists and horse riders; stated passing distance and speed.
What the study found
Immediate targeted attitude and intended-distance effects were replicated in the retained subset, but no intervention advantage over baseline remained nearly 16 months later. In the reduced subset, cyclist-video effects on stated passing speed did not show the same immediate group-specific pattern. No negative rebound was found.
Limits
Condition table totals 223 although report text says 224 completed; only 65% of original sample completed follow-up; online intended behavior, not actual driving; the interval does not reveal when the immediate gains faded.
Study design
Approximately 16-month follow-up of original randomized cyclist/horse empathy-video groups using repeated online attitude and stated passing-distance/speed items.
R09Validating Dutch Reach: A Preliminary Evaluation of Far-Hand Door Opening and its Impact on Car Drivers’ Head MovementsLarge, D. R.; Choo, M. C.; Houghton, R. · 2018+
What was measured
Measured head rotation during near-hand and far-hand door opening in driver and passenger seats.
What the study found
Driver-seat mean head rotation was 5.81 degrees for near-hand versus 9.20 degrees for far-hand opening. No comparable hand effect was found in the passenger seat.
Limits
Preliminary single-vehicle experiment; omitted a rear-hazard detection task; no behavior in traffic, cyclist detection, dooring incident, or injury endpoint; far-hand opening was only one component of the broader technique.
Study design
Repeated-measures psychophysics experiment in one right-hand-drive Honda Civic; head motion measured during near-hand and far-hand door opening in driver and passenger seats.
Sample
participants: 10; door openings: 80; unit: participants and repeated door-opening trials
Access
Full author-posted conference paper and institutional record
This trial compared bicycle light use with usual light routines. It tested equipment use, not
the effect of a message encouraging it. Choose an outcome to see its estimated rate ratio and
95% confidence interval.
Below 1 means a lower rate in the test group. The interval shows a range compatible with the
data under the study model. This interval crosses
1, so the result is uncertain and is also compatible with equal rates.
Put safer infrastructure first. Designing and building safer streets is a leading, durable way to prevent serious injuries and deaths. Prioritize safer roads and speeds, including protected space for riding, safer intersections, and street designs that reduce dangerous vehicle speeds. Choose designs that fit the local roads and community.
Act with the tools your community has. Limited funding, political barriers, and other constraints can delay street improvements. In some communities, behavioral campaigns and practical support may be the tools available now. Use them to address immediate needs while continuing to work toward safer street design.
Why these topics were chosen. This report focuses on messages, education, and support for behavior change for which we found credible studies or evaluations. Other strategies may be more effective, and safer infrastructure remains the priority. The chapters reflect the evidence available to inform practical choices, rather than a ranking of the best safety solutions. Some findings support an idea worth testing; others measure changes in behavior or injuries.
Effective campaigns give people a clear action and a practical way to carry it out. The findings below translate the research into seven decisions for planning, testing, and improving a campaign.
Quick takeaways
Pick one road situation, such as passing on a narrow street.
Say who needs to act and what to do.
Give people the tools or help they need to act.
Check what people learn and do. Track crashes and injuries too.
Seven decisions for better campaigns
Give people a clear task. Say who should act, when, and what to do. For a passing campaign, try a direct instruction such as “No safe room to pass? Slow down and wait behind.” Test whether drivers understand when to wait and how to leave room.
Pair advice with practical help. If you ask riders to use lights, offer lights and fitting help. If you ask families to build riding skills, provide supervised practice. For a passing campaign, work with driver trainers, fleet managers, and qualified enforcement partners to explain and reinforce safe passing.
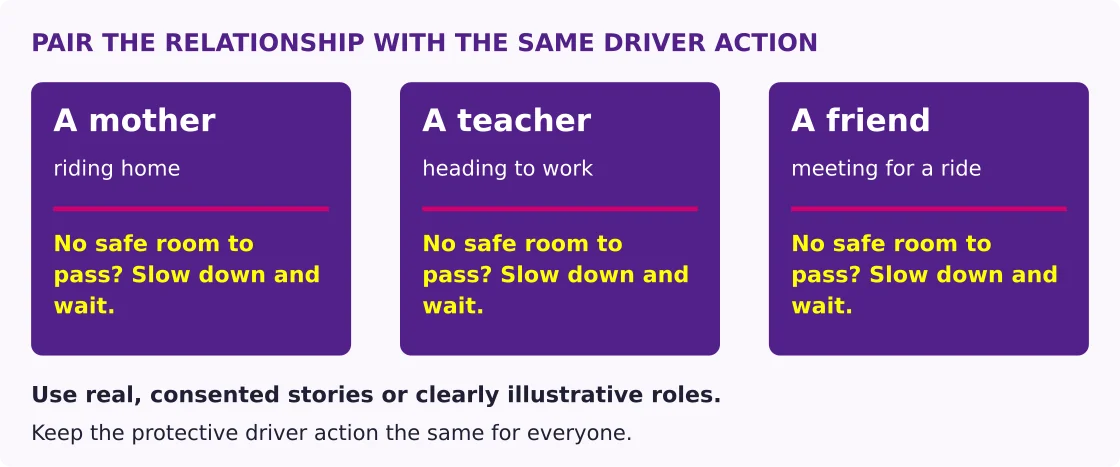
Put a human story beside the safe action. Show an everyday ride: a parent heading home, a teacher going to work, or friends meeting for a ride. Pair the image or short story with a driver action such as waiting to pass. Compare versions with your audience, then check the response again later. Story studies support testing this approach for attitudes and intentions.
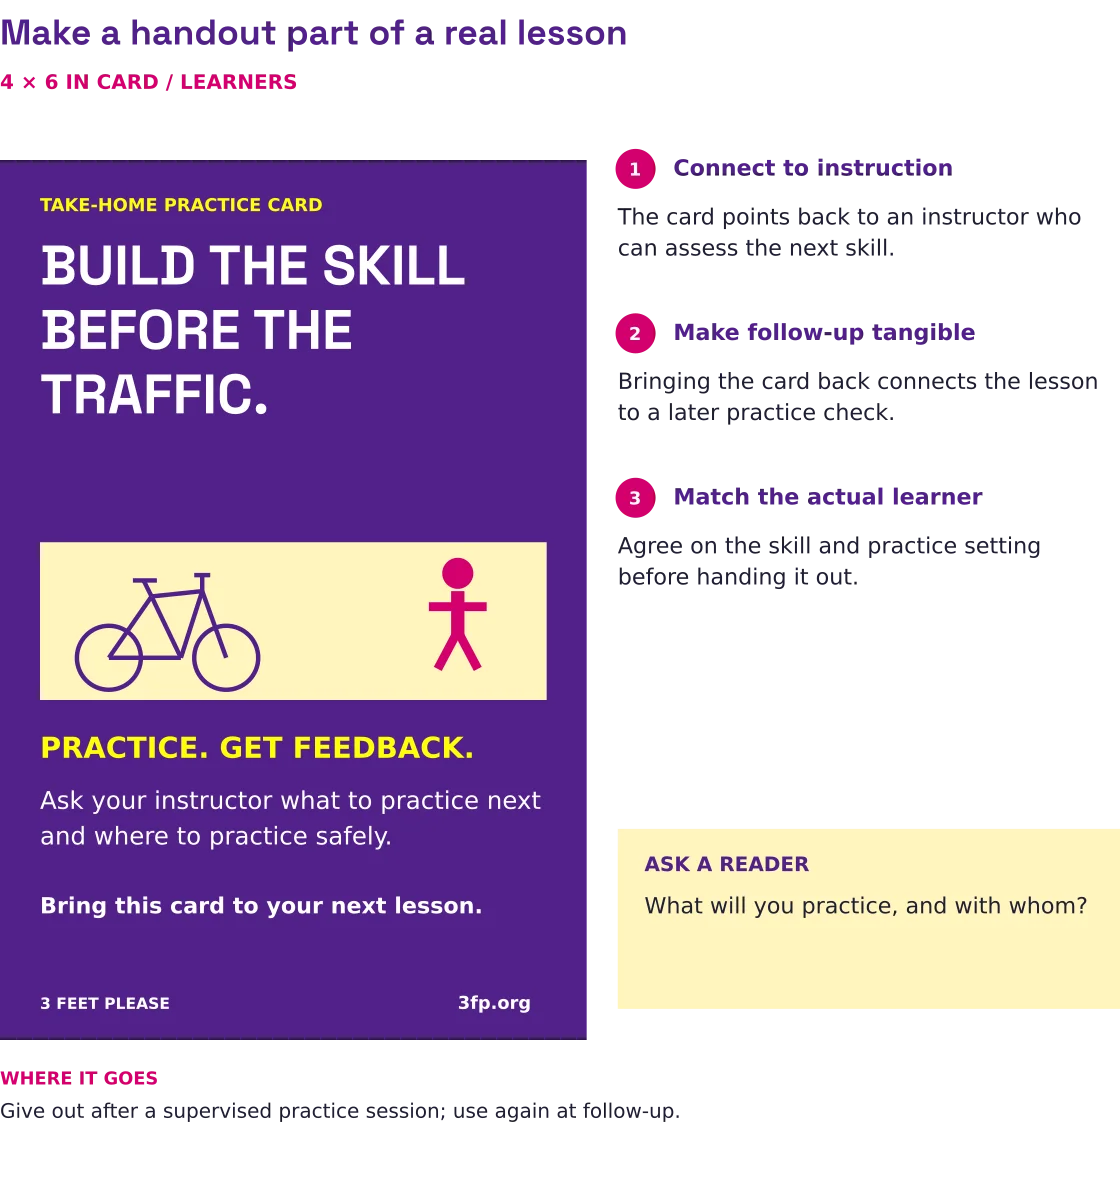
Let riders practice the advice. Show the skill, let people try it with a trained instructor, and give feedback. Use a handout to recap the lesson and point to the next practice session. For gear advice, show correct fit and use, then help riders check their own equipment.
Choose art and tone by testing the action. Ask viewers to explain what to do next. Check whether the image makes that action clear and whether fear or blame gets in the way. Choose the version that helps your audience understand and act.
Reach the whole community. Use places, languages, and formats that fit the people you want to reach. Ask whether the campaign makes riding feel more welcoming. Track who takes part and who needs more help.
Connect the campaign to safer streets. Explain how to use a new bike lane or junction, support safe speeds, and tell people where to report a hazard. Coordinate the message with the road changes, services, and partners that help people act safely.
01
Scope, method and how to use this review
+
This review brings together research on road-safety messages, education, equipment, and campaign delivery. It is designed to help community organizations choose useful actions and adapt them to local roads and audiences.
Quick takeaways
Start with the decision guide.
Read the topic chapter before making a claim.
Check what each study measured and where its findings apply.
The question
Which messages, images, educational approaches and delivery arrangements have evidence relevant to improving safety for people riding bicycles? What was actually measured, what might explain a result, and what should an organization do with that uncertainty?
The intended readers are advocacy groups, local authorities, road-safety teams, schools, public-health organizations, employers, cycling organizations and creative agencies. Adapt examples to the community and test them with the intended audience. Road direction, passing laws, lane rules, vehicle fleets, language and available services must be checked in the intended setting.
Review approach
This targeted critical literature review draws on research reviewed through 28 October 2026. It brings together studies of road-safety messages, cyclist education, equipment, and campaign delivery. We selected these topics because the literature provided credible findings relevant to a community campaign: message understanding, attitudes, practical skills, equipment use, behavior, or injuries. We also included useful null or adverse findings. A topic's inclusion means there is evidence to learn from; it does not mean every approach within it is effective. Other strategies may work better but have less relevant evaluation evidence available to this review.
The 3 Feet Please data team contributed human research design, data synthesis, and editing. AI assisted with research and drafting. The report draws on studies, evaluations, reviews, and practical guidance.
Use the examples in your own material
The example panels show draft words, layouts, and scenes you can adapt. The practical recommendations combine study findings with the cited planning guidance; the exact sample slogans and artwork are drafts to test with the intended audience before publication. For each one, keep the safe action clear, check the local rule and road layout, and ask intended users to explain what happens next. The role labels and sample results are illustrative. Captions explain the decision each example helps you make.
The eight Print examples show complete poster, card, and counter-sign drafts beside design notes. Each caption connects the concept to the evidence and gives a practical check before use. The dimensions describe the intended finished piece; the report shows reduced previews. The editable SVGs let you replace copy and artwork.
Choose evidence that fits your campaign goal
Look at what a study actually measured before using its findings. For example, a survey about a passing message can help you choose clear words. A study that observes passing distance can help you understand changes in driver behavior. Use each finding to plan the part of your campaign it addresses.
When sharing a result, name the audience, what the researchers measured, and the setting. Check whether the local roads, rules, and services match the study. For your own campaign, choose a goal and measure it: ask drivers to explain a passing message, observe passing behavior with qualified partners, or track participation in a training program. Section 12 offers ways to plan those checks.
02
Choose a starting point for your campaign
+
Start with the problem your community wants to address. The guide below connects common situations to a first action and a practical check. The named chapters explain the evidence and show examples you can adapt.
Quick takeaways
Pick the situation you want to change.
Choose one action people can take.
Check that people have the help they need.
Decide how you will check the result.
If your community is facing...
Start with this action
Check before you print
Drivers passing too close
Show drivers when to slow down, wait, and pass safely.
Check local rules and ask drivers to explain the scene. See section 4.
Drivers opening doors or turning across a rider's path
Show where to look and when to wait.
Check the road layout; use a diagram or a parked door demonstration. See section 5.
Drivers overlooking the person riding
Pair an everyday story with a clear driver action.
Ask the audience what to do and whether the story affects blame or fear. See sections 6 and 7.
Riders needing more practice
Connect a reminder to instruction, supervised practice, and feedback.
Confirm the lesson is available and check the skill taught. See section 8.
Riders needing equipment or fitting help
Show correct use and connect the message to available gear or fitting help.
Confirm cost, access, and the equipment guidance. See section 9.
Example: A group hears that drivers squeeze past riders on a narrow street. It checks local rules, shows a driver waiting behind a rider, and asks drivers to explain when they would wait. The group then works with a qualified partner if it wants to measure actual passing behavior. Section 11 develops a sample passing campaign.
A message is one part of the response. Match it to the problem: a skill may need practice, equipment may need fitting help, and a narrow or unsafe road may need attention from the responsible agency. Sections 3 and 10 help plan that support.
03
Why a message might work
+
People need more than a reminder when a safer action is unclear, difficult, or out of reach. This section shows how to identify the barrier and choose a matching explanation, service, or change to the road environment.
Quick takeaways
Ask what makes the safe action hard to do.
Check what people know and can do.
Check access to gear and safe roads.
Choose a message and support that meet those needs.
Tell people what to do
The sign-comparison study in section 4 found that “Bicycles May Use Full Lane” communicated lane-use rights more clearly than “Share the Road.” Use explicit actor-and-action language, then check how the intended audience interprets it. A short explanation of a hazard can also make an apparently puzzling lane position intelligible. Use audience interviews to check whether the explanation resolves the intended misunderstanding.
Write around one observable encounter: waiting to pass on a narrow road, checking before crossing a bicycle's path, or looking before opening a door. A brand statement can support recognition, but should not obscure the task. Multiple pieces can work together: a brief prompt, a demonstrated action, and a take-home explanation. Test length and repetition in the places where the audience will see the message.
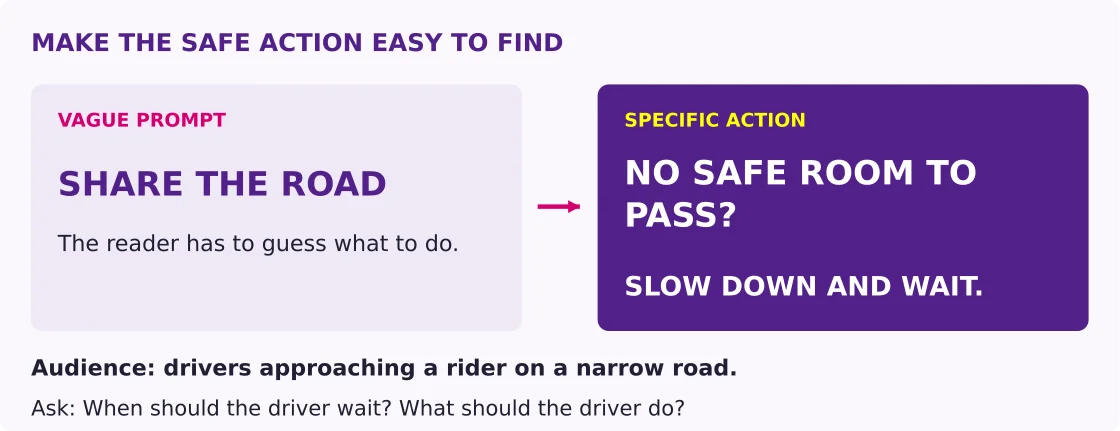
Figure 1. Rewrite the prompt. Name the situation and action. Use the action-focused version as a draft, then ask drivers to explain when they should wait.
Diagnose the barrier before choosing the channel
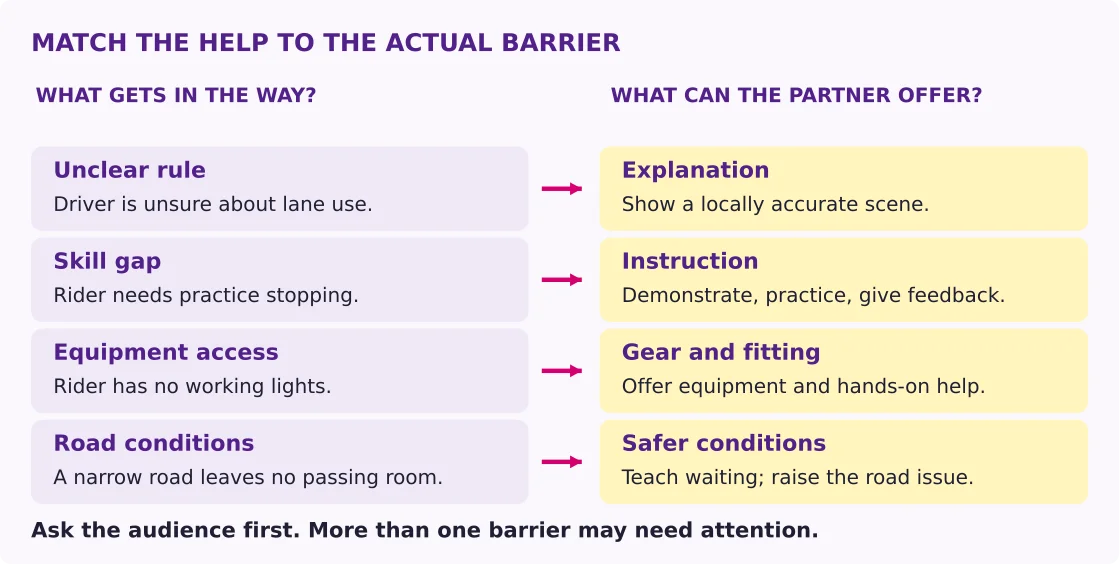
A useful planning tool is the Capability, Opportunity, Motivation and Behavior model (COM-B). Developed by Michie and colleagues, it asks three questions: do people have the knowledge and skills to act (capability); do their surroundings and resources make the action possible (opportunity); and do they have reasons or habits that support it (motivation)? Use the answers to choose the right kind of help. A rider without a working light needs access to equipment; a driver who misunderstands lane use may need an explanation. Michie, van Stralen and West, 2011R29.
Figure 2. Match support to the barrier. Ask the audience what gets in the way; barriers may overlap. The examples illustrate a planning approach, so test the response locally.
Ask the audience what is unclear, what prevents safer action, and where the decision occurs. Match the response to the barrier: explanation, supervised practice, affordable equipment, or changes to roads, speeds and enforcement.
The Campaigns and Awareness Raising Strategies in Traffic Safety (CAST) manual is a European guide to planning road-safety campaigns. It recommends a practical sequence: define the problem, study the audience and context, set specific objectives, design the campaign and its evaluation, deliver it, then use the results to improve the next cycle. A 2023 National Academies toolkit offers similar planning tools for reaching people who face particular risks in traffic, including people walking and cycling; use it to plan audience research and delivery. CAST manual, Part II, 2009R47; National Academies vulnerable-road-user toolkit, 2023R63.
Tyagi and colleagues explored campaign preferences in workshops with 30 young adult vulnerable road users in the Australian Capital Territory and Victoria. Invite the people you need to reach to discuss what a message means and how it fits their travel. Tyagi, Wragg and Suhendra, 2025R59.
04
Passing and lane position: clarity with behavioral follow-through
+
Drivers need to recognize when a safe pass is possible and why a rider may use more of a lane. Studies show that explicit lane-use wording can improve understanding, while results from roadside signs and broader passing programs vary by measure and setting.
Quick takeaways
Tell drivers to slow down and wait when there is no safe room to pass.
Check local passing laws.
Ask people to explain the message before you share it widely.
The strongest wording comparison is about understanding
In an online image survey with 1,824 U.S. responses, people were assigned by chance to see different signs. The sign “Bicycles May Use Full Lane” more consistently communicated lane-use rights than “Share the Road.” Participants were recruited through Twitter, so the sample may not represent all drivers. Responses concerned pictured situations rather than actual passing. The finding supports explicit rule communication in the setting studied. Check the local lane-use rule and test whether the wording explains it clearly. Hess and Peterson, 2015R15.
A field study of Share the Road signs on high-speed rural two-lane roads reported lower passing speed and changed lane position, but no statistically clear increase in the space between the vehicle and bicycle or reduction in close passes. The measures changed in different ways. Report speed, lane position and clearance as separate results. Kay et al., 2014R22.
An Austin before/after study observed drivers giving more room at one site after full-lane signs were installed, alongside more encroachment into the neighboring lane while passing. A passing ordinance also changed during the study, and the second site had few passing observations. Use this example to plan checks for both passing room and the surrounding traffic context. Mills et al., 2010R02.
A Norwegian sign using “Share the road” with an illustration was followed by improved self-reported passing behavior on the test road relative to a comparison road. The two surveys took place at different times and the roads served mainly recreational traffic. The U.S. wording study above measured how people interpreted signs; the Norwegian study measured what road users reported doing. Both can inform local pretesting. Høye et al., 2016R64.
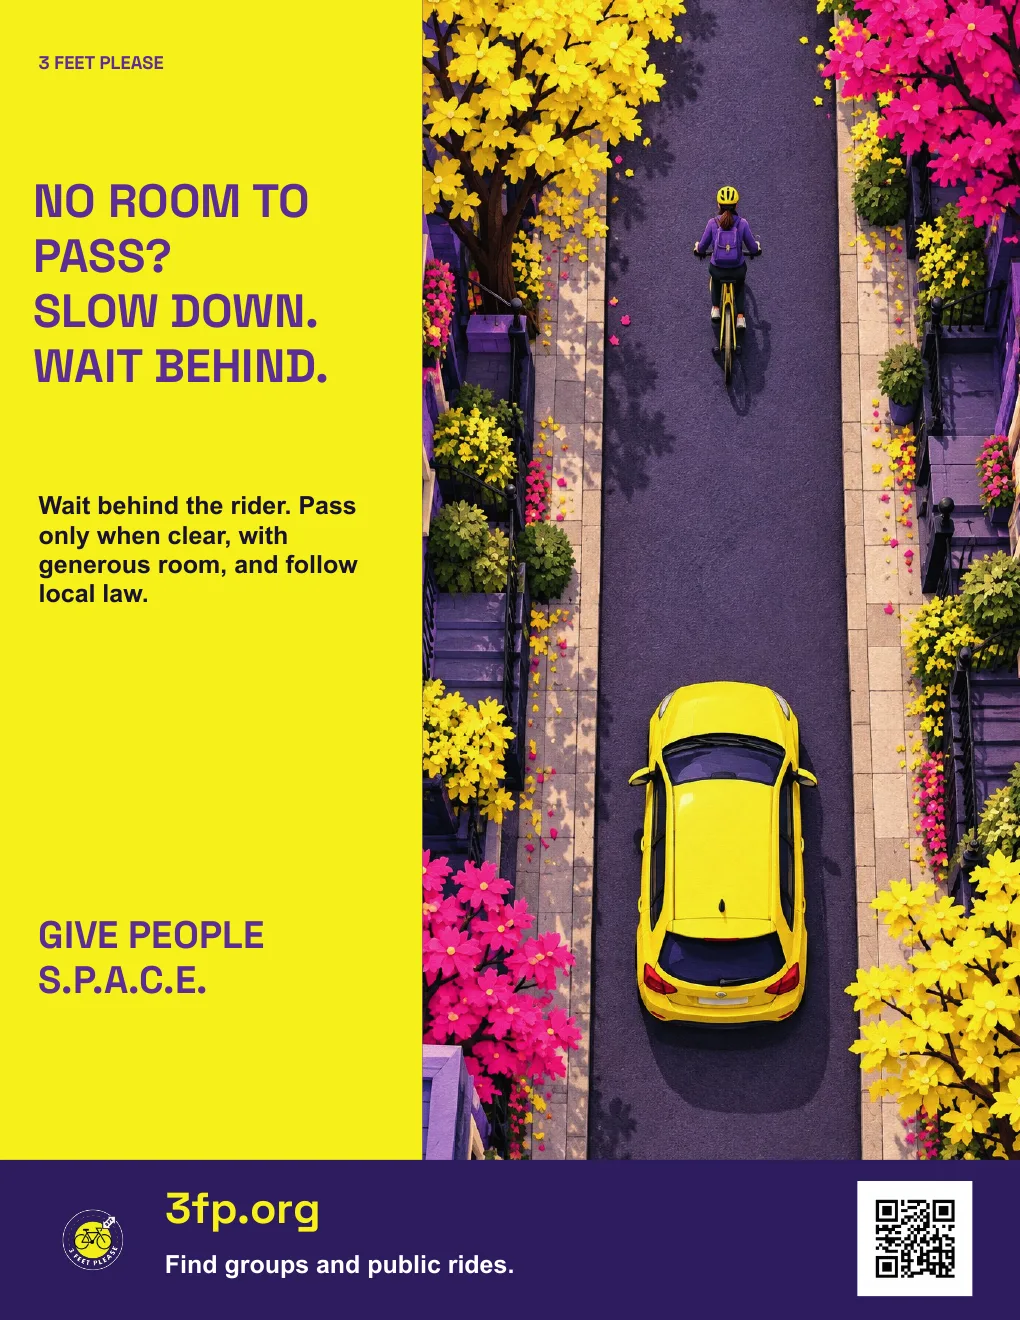
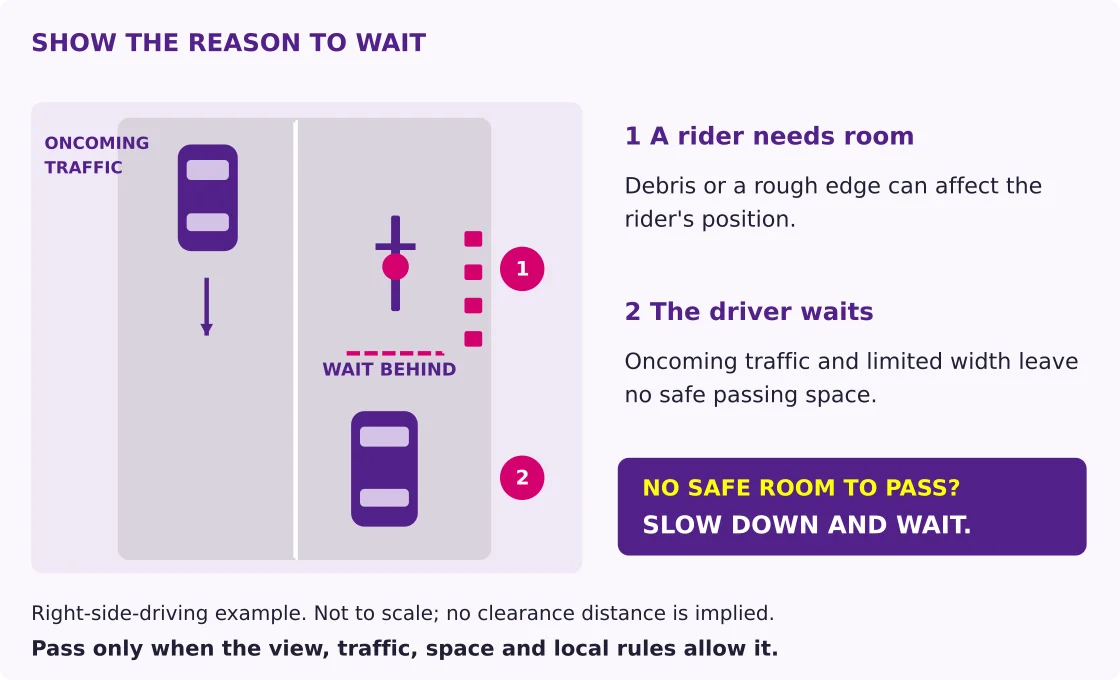
Figure 3. Show why waiting is the right choice. This schematic depicts a waiting position. In your own material, show the local road context and the space needed for a lawful, safe pass.
Coordinate passing advice with enforcement
The U.S. National Highway Traffic Safety Administration (NHTSA) evaluated a program that paired publicity with police enforcement of passing laws. Bicycles fitted with measuring devices recorded how much room drivers left. After about four months, average passing distances increased and the share of passes violating the applicable minimum-distance rule fell in both study cities. These were measured encounters during a combined publicity and enforcement program. Blomberg et al., 2022R34.
For a community campaign, agree on the passing advice, delivery plan, and behavior measures with the responsible agency. Enforcement also requires legal authority, safe implementation, proportionality and review of who bears burdens. An advocacy group should not recreate hazardous roadside encounters or have volunteers manufacture close passes to evaluate a leaflet.
Explain a passing rule and check understanding
A 2025 evaluation assigned 254 UK drivers by chance to one of three groups to assess a Highway Code film; 210 completed a check 4-6 weeks later. Knowledge of cyclist overtaking distance and pedestrian-priority turning rules improved, with some knowledge still present at the later check. The turning item was about pedestrians, not cyclist priority. Outcomes were questionnaire knowledge and self-reported intentions, not actual driving. Use a short rule-explanation film when the campaign goal is better understanding, and check what people remember several weeks later. Box, 2025R14.
A 2026 Perth study measured passing for 70 cyclists before and after a minimum-passing-distance law introduced alongside advertising. On roads at or below 60 km/h, the closest 5% of passes were estimated to be 10 cm farther away afterward (95% confidence interval, or CI: 2-19 cm); no clear change was detected on roads at or above 70 km/h. A 95% confidence interval gives a range of estimates consistent with the study data and its statistical model; a wider range indicates more uncertainty. Here, the result describes the closest passes after a law and advertising were introduced together. Sinclair and Nolan, 2026R23.
A driving-instructor pilot illustrates the importance of reaching the intended audience. Of 13 attitude items, two improved among instructors assigned to training: agreement that cyclists are a nuisance and that crashes are usually the cyclist’s fault both fell; the result about blame was less certain after accounting for the number of questions tested. Only 15% of instructors assigned to the training completed both the course and the final survey; no learner completed both the learner course and final survey. Plan reminders, scheduling and access before launching training. Ipsos UK, 2022; published online by DfT in 2024R19.
Victoria's passing-distance campaign provides another objective-behavior example, but the available conference extended abstract has limited detail. It reports a lower close-pass rate after the campaign, but leaves the scale of the percentage change ambiguous. Narrow roads, parking and roads with two or more lanes were associated with higher close-pass rates. Use local encounter data to choose sites and tailor the road scene in the material. The pre/post study had no similar untreated comparison group or crash outcome, so the size and cause of the change remain uncertain. McIntyre et al., 2019R01.
Choose where drivers will actually see the message
A study interviewed 364 passersby over five days, showing a cyclist-safety image on two intervention days. Compared with days without the image, it found no statistically clear improvement in prioritizing “look out for cyclists” or recalling the image's numerical claim. These were survey outcomes after brief exposure. For a local campaign, check that the audience sees the display long enough to understand it, then compare it with other ways to reach drivers. Dalton, Sumner and Jones, 2020R65.
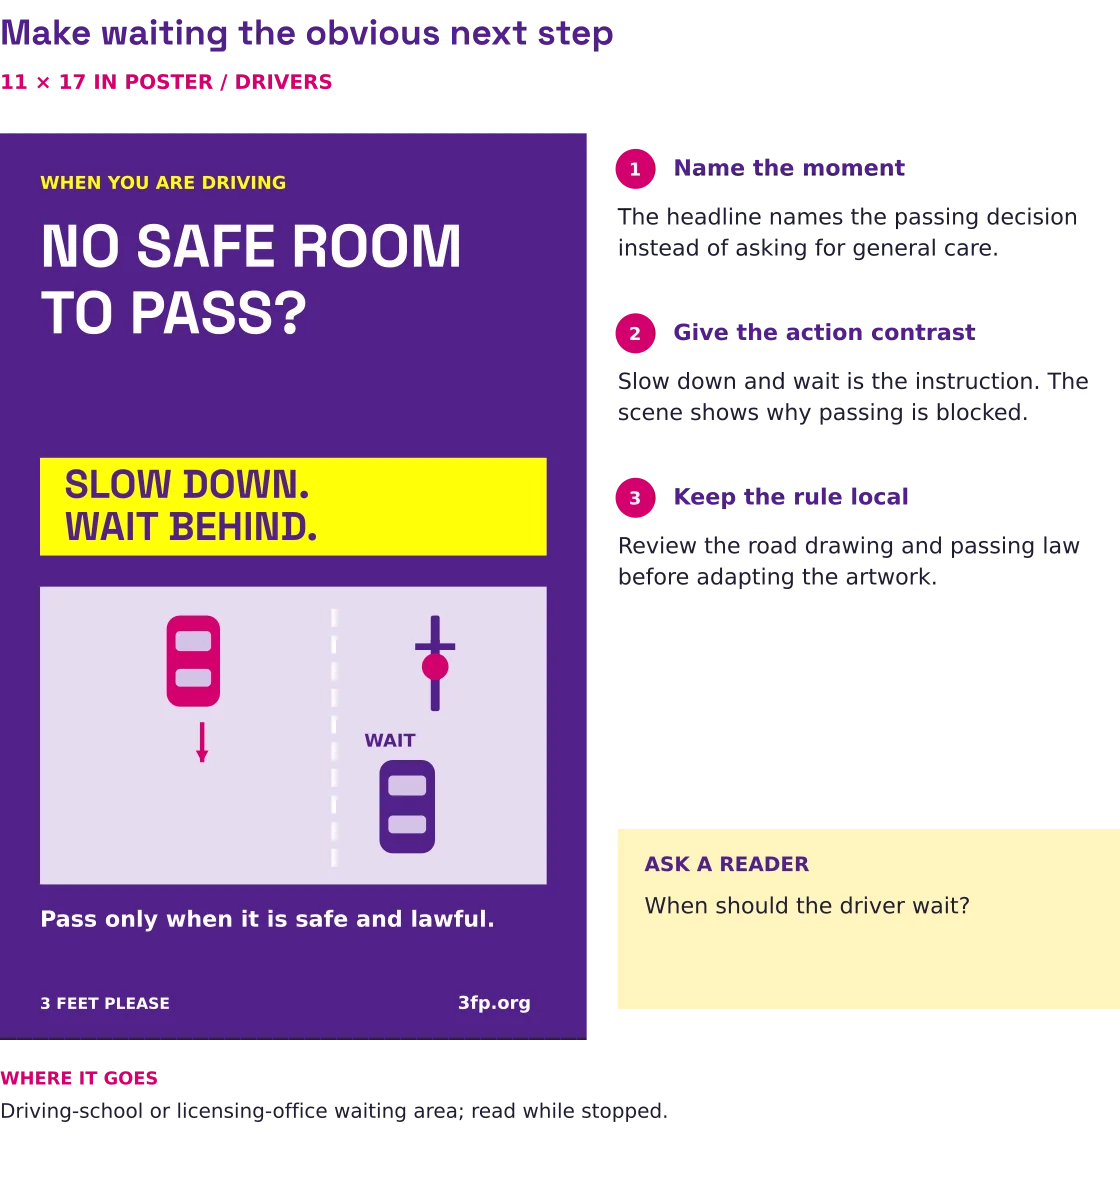
Print example 1. Make waiting the obvious next step. Use a specific action and a scene the audience can explain. The sign-comprehension study informs the clear instruction; the new artwork and wording are illustrative. Test the road scene and the meaning of waiting. R15, R67.
05
Doors, junctions and large vehicles
+
Opening a car door or turning across a bicycle's path can create a sudden conflict. Show the driver where to check and when to wait, and pair reminders with a safe demonstration that fits the local road and vehicle.
Quick takeaways
Show where to look before opening a door or turning.
Show when to wait for a bike to pass.
Practice in a safe place away from moving traffic.
Check that the message puts the duty to act on the right person.
Show the check, then rehearse it
“Look before opening” and “check before turning across a rider's path” describe teachable behaviors. A small commissioned evaluation of VicRoads car-dooring stickers examined awareness and reported responses, not collision reduction. Its follow-up included 11 sticker recipients, four of whom initially did not remember a sticker. Only one of those 11 reported putting a sticker on a car. Participants also had trouble with the term “car dooring.” Explain the hazard in plain words, such as opening a door into a rider's path, and pair the reminder with a discussion and demonstration of the check. Concepts of Change and Ipsos Social Research, 2013R06.
A preliminary Dutch Reach study of 10 participants found greater head rotation with far-hand opening in the driver seat, without a comparable hand effect in the passenger seat. It deliberately omitted a rear-hazard detection task. The study measured head movement; hazard detection and later habits need further testing. Large, Choo and Houghton, 2018R09.
Demonstrate a far-hand door-opening technique as a prompt to look behind. Ask participants to show the full check and explain when it is clear to open. Vehicle layout, mobility limitations and passenger position matter. Demonstrate in a secured parked vehicle, away from live traffic; do not open a door into a cyclist's path as a teaching exercise.
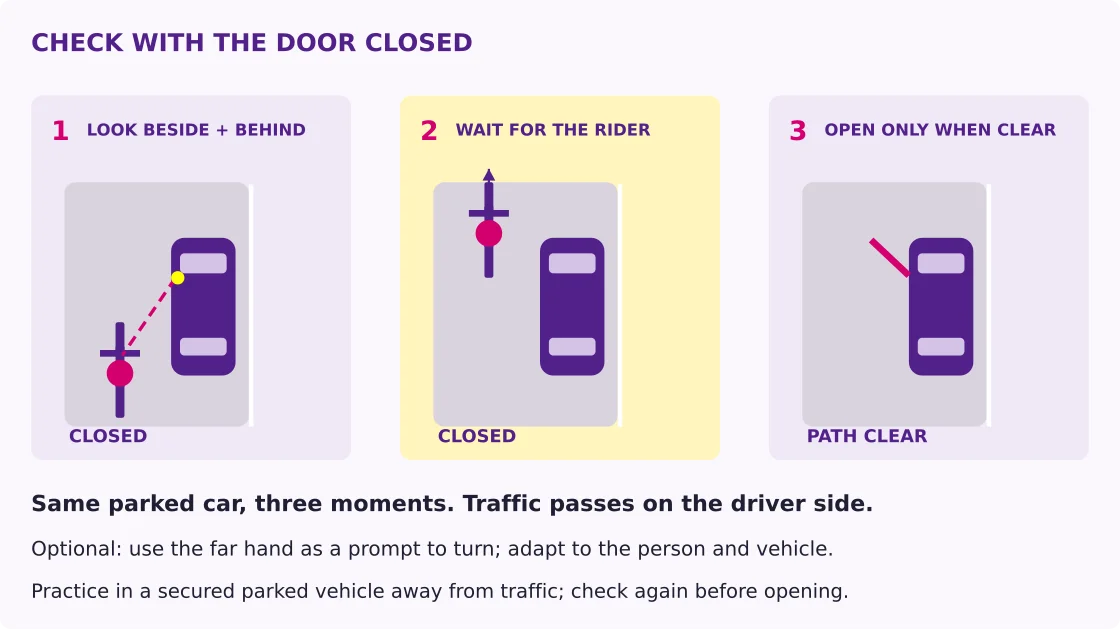
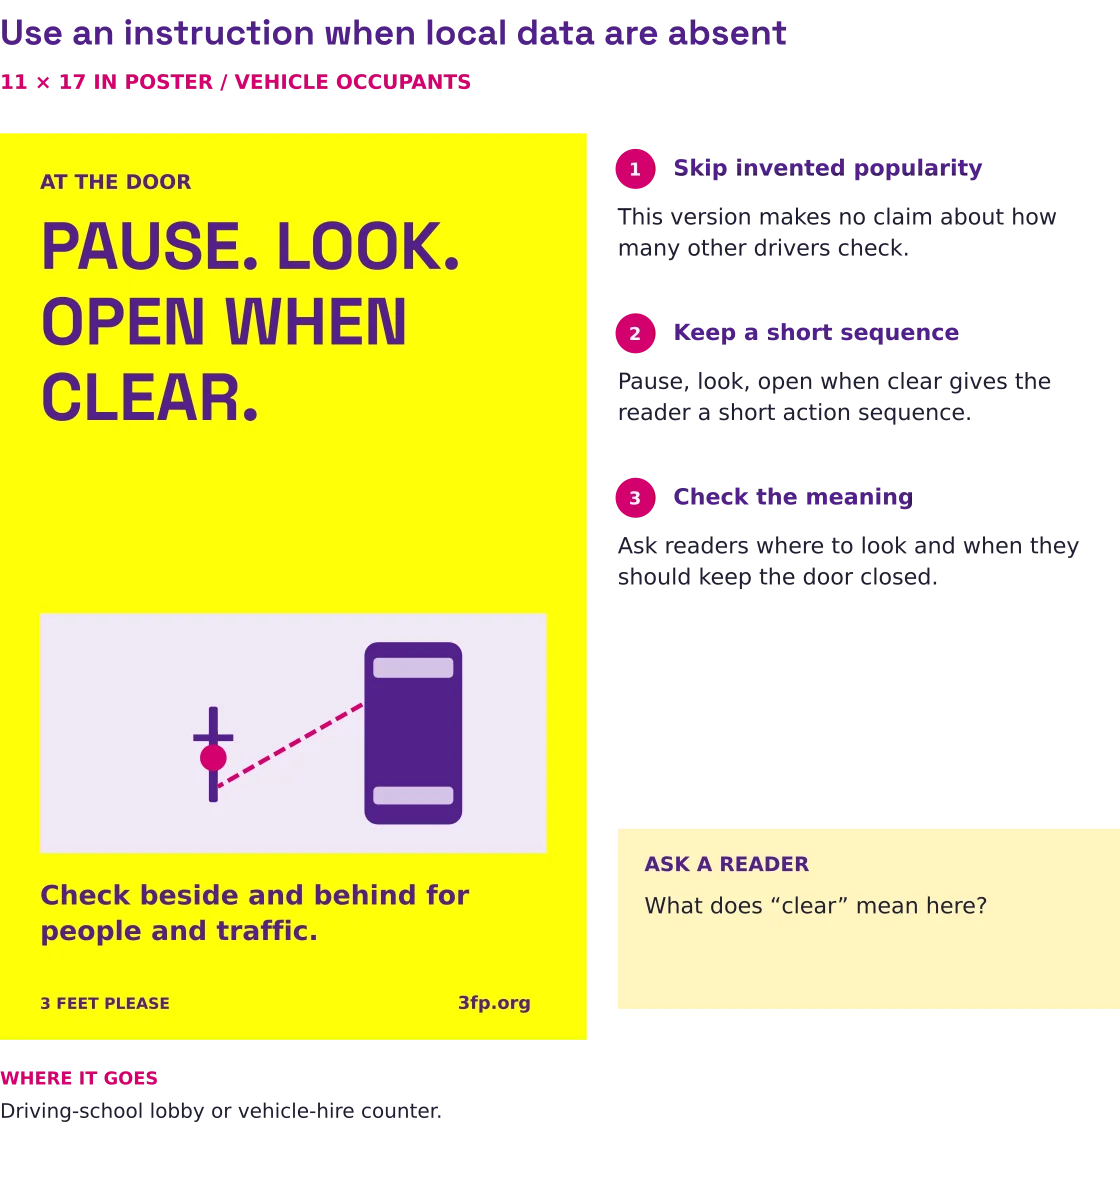
Figure 4. Make the door check a sequence. Put the check before the open door. Using the far hand can prompt a turn to look behind; adapt the check to the person and vehicle. Ask viewers when the door must stay closed.Print example 2. Turn advice into a short sequence. Pair the card with a parked-vehicle demonstration. R06 examined how drivers understood door-opening reminders; R09 examined head movements during a door check. Ask the reader to explain and demonstrate the sequence. R06, R09.
Do not transfer the whole prevention burden to the rider
Large-vehicle and junction messages should tell drivers what to check and when to wait, alongside relevant rider guidance. Avoid wording that suggests a rider can reliably identify every blind area, ensure a driver has seen them, or make an unsafe junction safe by choosing perfect positioning. Guidance must match local road rules and the actual vehicle/road geometry.
Fleet example to test: “Before turning, check the rider's path and wait until it is clear.” Use the actual vehicle and road layout in a training session: show the driver's direct view, mirrors, and visibility equipment, and discuss the areas the driver cannot see. Fleet managers should review vehicle-specific equipment and turning procedures with a qualified trainer. The WHO cyclist-safety guide discusses enhanced mirrors and other vehicle measures. World Health Organization, 2020R45.
The THINK! “Don't get caught between” evaluation illustrates a tradeoff. In its 2016 cyclist survey, 46% agreed that the advertisements put collision blame on cyclists; 21% said they were likely to cycle less, while 2% reported actually doing so because of the advertisements. These are separate self-report questions, not measured causal changes in riding or injury. The case warrants explicit testing of blame and participation effects. THINK!, 2016R12.
Example to pretest: “Before turning across a bicycle's path, check and wait until the rider has cleared.” It needs local review and a scene that accurately shows the intended interaction. Test whether the audience understands the sequence rather than simply recognizing the hazard. Include riders approaching at different speeds, including e-bikes, and ask drivers when they would wait.
Figure 5. Show the turning driver waiting. Redraw this example for the actual traffic direction, signals and road layout. For large vehicles, use vehicle-specific visibility information rather than a generic blind-spot outline.Print example 3. Give the turning driver a clear job. Use an actual local layout in the final design and teach the vehicle-specific visibility check. The illustration applies the safety guidance discussed in this chapter. R45.
06
Human stories, identity and blame
+
Images and stories can influence how audiences see people who ride. Some studies found changes in immediate attitudes or intentions; use those findings to test respectful stories alongside a clear action for drivers.
Quick takeaways
Show an everyday ride people can relate to.
Show a mix of people and reasons to ride.
Pair each story with a clear driver action.
Test what people do as well as how they feel.
Pair everyday stories with clear actions
A poster experiment in the Australian Capital Territory (ACT) asked 267 respondents to compare photographs and graphic images of cyclists. Participants rated cyclists in photographs as more human than cyclists in graphic images. Across all participants, photo versus graphic design did not produce a clear overall difference in attitudes; graphics were rated clearer, more memorable and more effective. Everyone saw a message, so there was no comparison with seeing nothing. Overall, front and rear views did not differ clearly on attitudes, although drivers responded more favorably to the front view. Photograph-first presentation order limits interpretation of image-type differences. These are immediate survey findings, not actual driving. Haworth et al., 2024R31; ACT project reportR31.
Figure 6. Pair a backstory with the driver action. The fictional story gives an everyday ride a personal context. The person is AI-generated and the story is invented; test this draft with the intended audience.
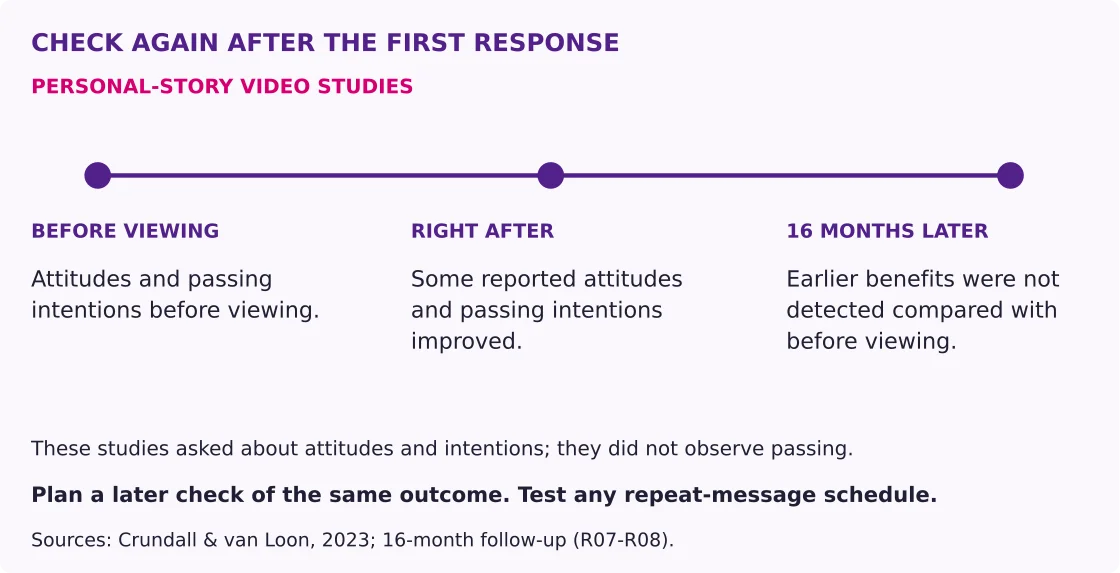
In Crundall and van Loon's research, videos with personal backstories improved the attitudes drivers reported and their immediate stated intentions about passing. An indirect test of automatic associations did not show an improvement. A later follow-up did not find the earlier benefits persisting. Try a short personal story beside the passing instruction, and plan a later check of attitudes and intended behavior. Crundall and van Loon, 2023R07; Crundall and van Loon, 2023 follow-upR08.
Figure 7. Check whether the response lasts. The two video studies covered cyclists and horse riders. This timeline summarizes assessment points, not the size or shape of change between them. Plan a later check of your own campaign; the follow-up did not test a repeat-message schedule. Sources: R07-R08, cited above.
A pilot study linked dehumanization ratings with self-reported aggression. This observational finding adds a reason to test respectful portrayals alongside clear passing advice. Delbosc et al., 2019R10.
In a nonrepresentative survey of 563 Australians, viewers more often chose cyclists wearing helmets or safety vests as “less human” than otherwise similar images without safety gear. The outcome was a perception rating, not measured driver behavior. Pretest images with the intended audience and check how viewers perceive the person and the action. Limb and Collyer, 2023R60.
Figure 8. Vary the story, keep the safe action. Try everyday roles that fit the community. Check whether the story helps viewers recognize the person and remember the driver action.
Show everyday lives and explain who must act
Show people riding for ordinary purposes across ages, abilities, clothing and bicycle types. Choose images that reflect the people and trips in the community. A person should not have to be a parent, a professional, likable, athletic, or compliant with a stereotype to deserve protection. Pair a human story with the same concrete driver action that applies to everyone.
Do not fabricate quotations, crash-survivor accounts or identities. Obtain informed permission for identifiable people and stories. Generated imagery should be described as illustrative where viewers could mistake it for documentary evidence. Test generated and photographic images with the intended audience.
Experimental news-framing research found that choices in crash descriptions can change perceived blame and preferred solutions. The often-cited Goddard study concerns pedestrian-crash coverage, so transfer to cyclist-safety assets is indirect. Use it to review who is shown acting, what happened, and which road conditions are explained. Goddard et al., 2019R41.
A 2026 analysis of 204 French-language Swiss newspaper stories found that 83% of headlines centered cyclists, only 27% named an explicit agent, and 93% of articles focused on individual incidents rather than the wider road-safety context. It measured news content, not reader reactions or driving. Use this descriptive work to check whether headlines explain both the driver action and the road context. Reymond and Rérat, 2026R27.
A Bogotá case study mapped newspaper reports of cyclist deaths and injuries against place, infrastructure and socioeconomic conditions. It found uneven attention and safety conditions across the city. Check whose experiences the campaign depicts and which neighborhoods receive the materials. Torres-Barragán, Cottrill and Beecroft, 2020R61.
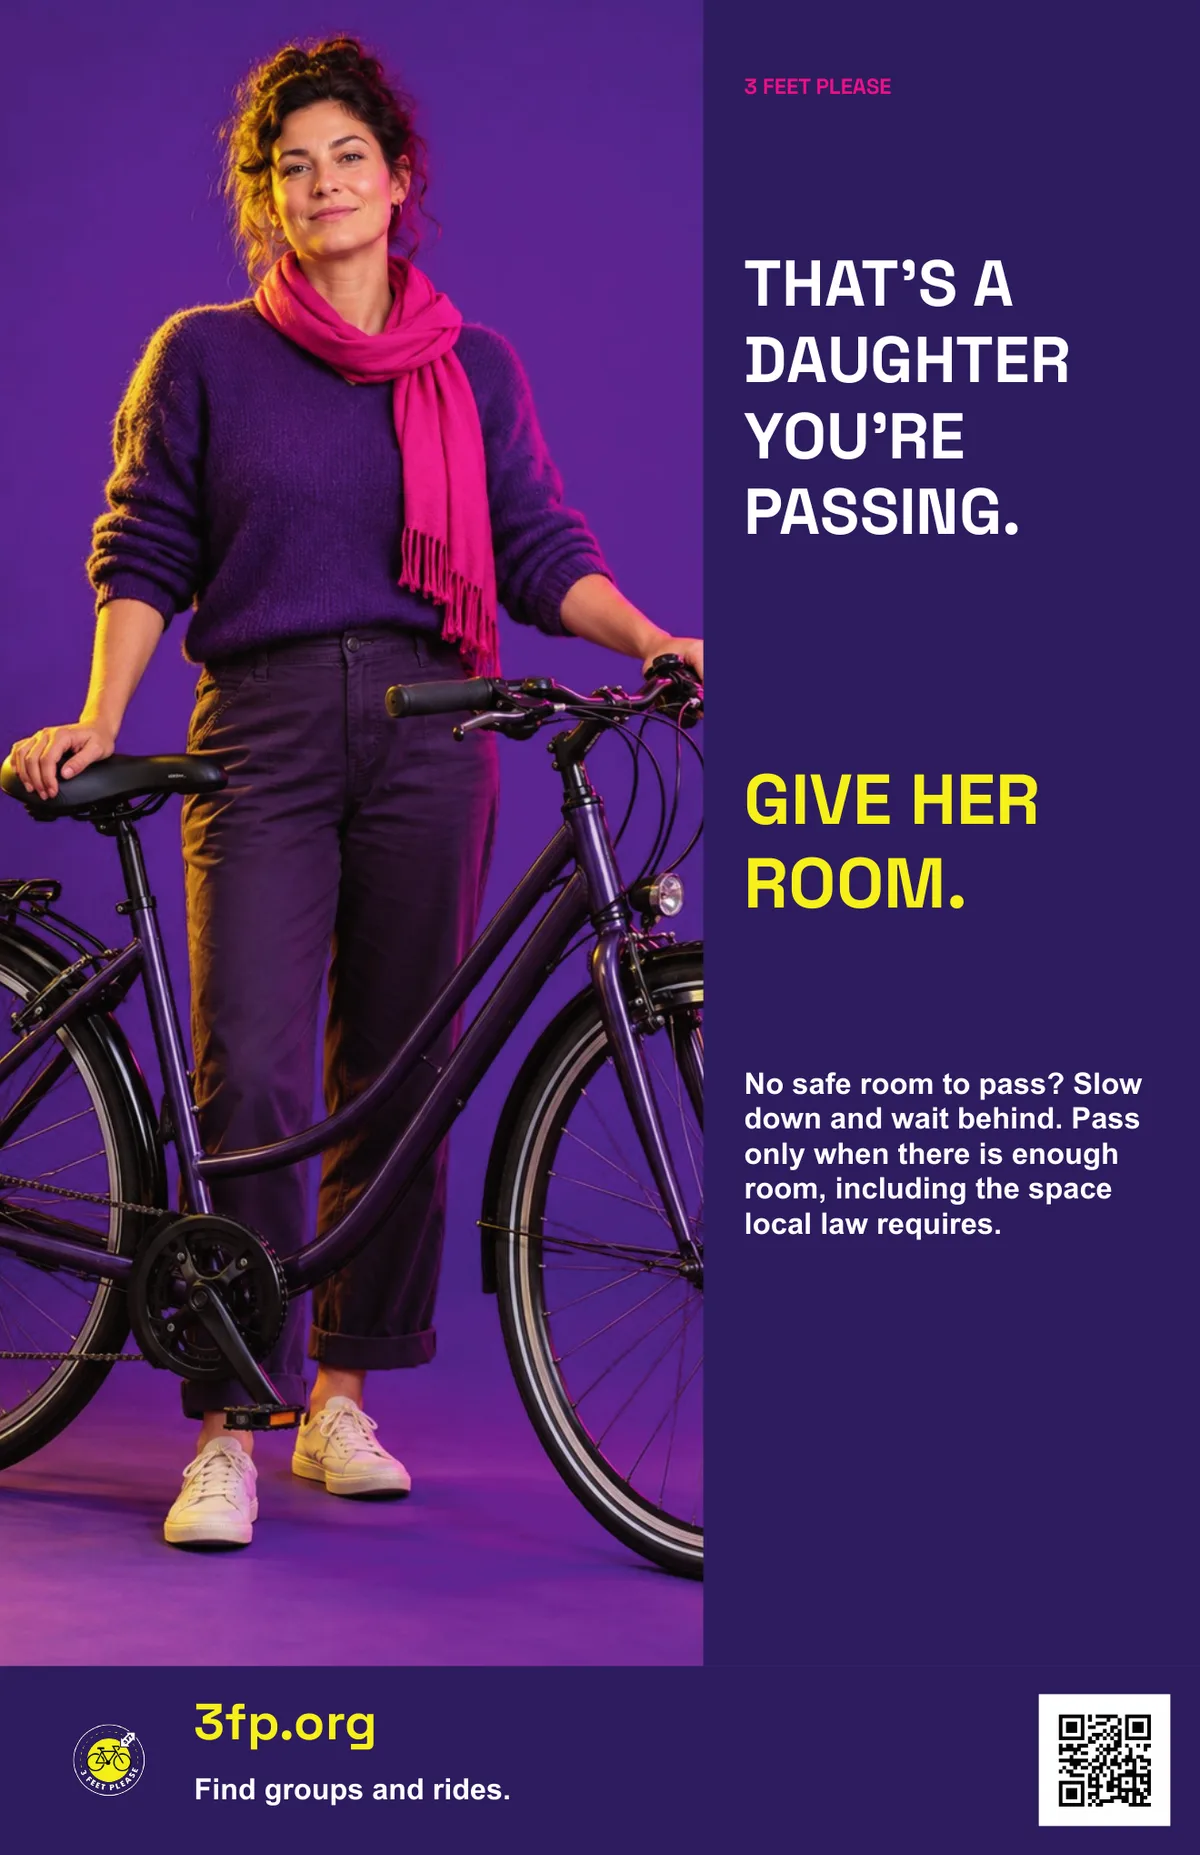
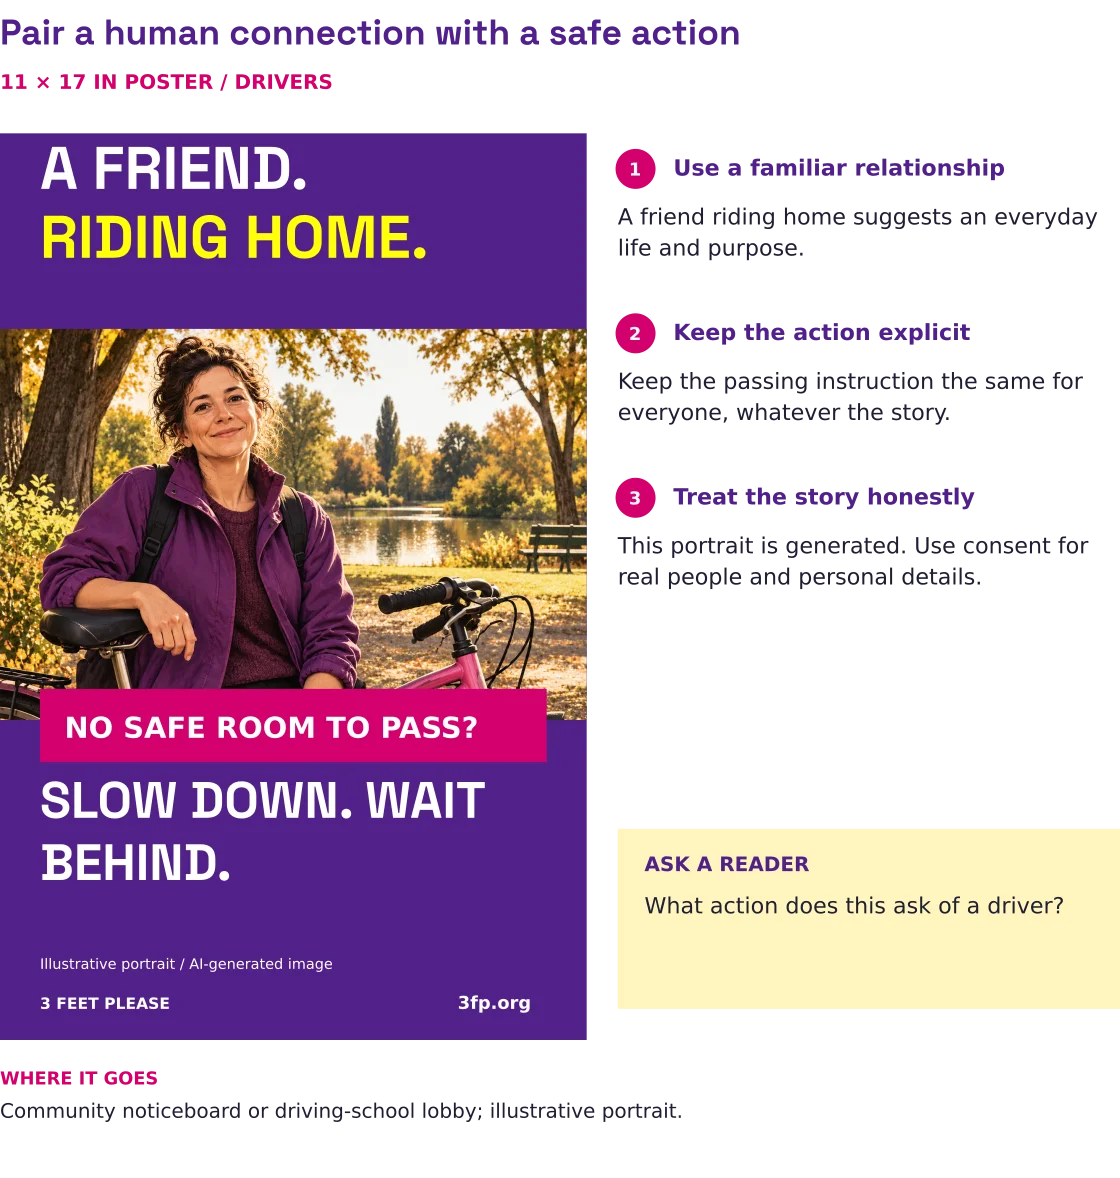
Print example 4. Pair a human connection with a safe action. The relationship headline is a creative hypothesis to test. The cited studies examined responses to photographs and videos. Check whether readers connect with the portrait and can name the driver action. R31, R07, R08.
07
Fear, social norms and creative style
+
Tone and design shape what people notice and how they interpret a message. A social-norm message describes what people commonly do or what their community approves of. Findings on fear and social norms vary, so test whether the audience understands the action and whether the message creates blame or discourages riding.
Quick takeaways
Ask people what the message tells them to do.
Check that they can do it safely.
Ask about fear, blame, or other harm the message may cause.
Choose art and tone based on these checks.
Test fear messages for benefits and harm
A meta-analysis combines results from several studies to estimate an average effect. One analysis of 13 driver-message experiments, involving 3,044 participants, found no statistically clear average effect on driving behavior or stated intentions (r=.03; 95% confidence interval: −.01 to .07). Here, r is a measure of the strength of the effect; a value near zero indicates little average change. The results came from varied tests, including laboratory tasks, simulations and self-reports. A smaller group of studies found that the messages increased fear; the analysis did not separately test graphic imagery. Carey et al., 2013R35.
A broader fear-appeal meta-analysis found a small positive average across varied attitudes, intentions and behaviors (d=.29; 95% CI .22 to .35), using a standardized measure of the average difference between groups. The analysis found stronger effects in some conditions, including messages that explained how to take an effective action. The studies covered different health and safety topics; the average is not an estimate for cyclist campaigns or collisions. Tannenbaum et al., 2015R28.
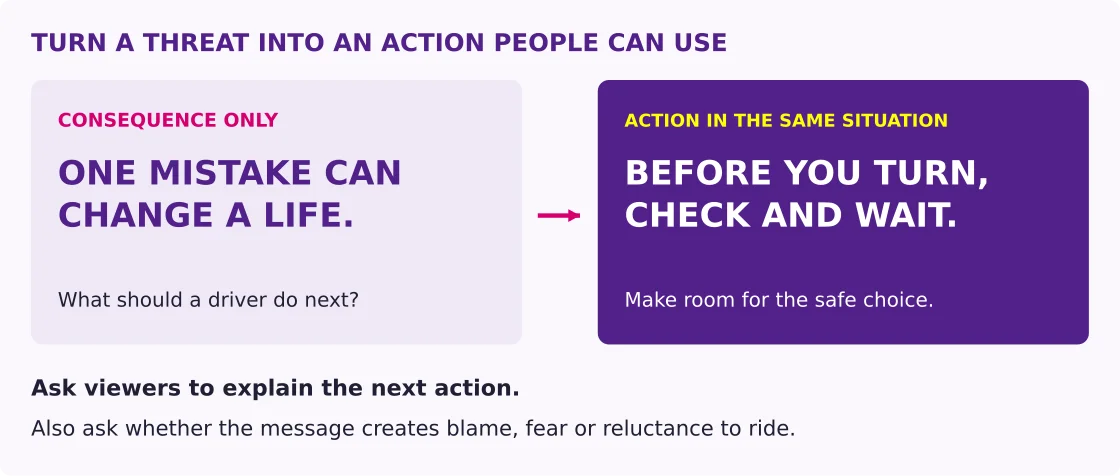
Use a consequence only if it helps the audience understand a feasible action. Pretest comprehension, defensive responses, blame, willingness to cycle and actual follow-through. Ask whether viewers can explain and carry out the safe action. Consent, dignity and the needs of people affected by road trauma matter independently of whether a striking image attracts attention.
A randomized online comparison of cycling leaflets found no immediate change in perceived cycling risk or intention from the safety-focused material. A health-focused version raised perceived health benefits among non-cyclists without changing their intention to ride. The trial measured immediate perceptions and intentions. Include a later participation check when evaluating a similar leaflet. Gamble, Walker and Laketa, 2015R57.
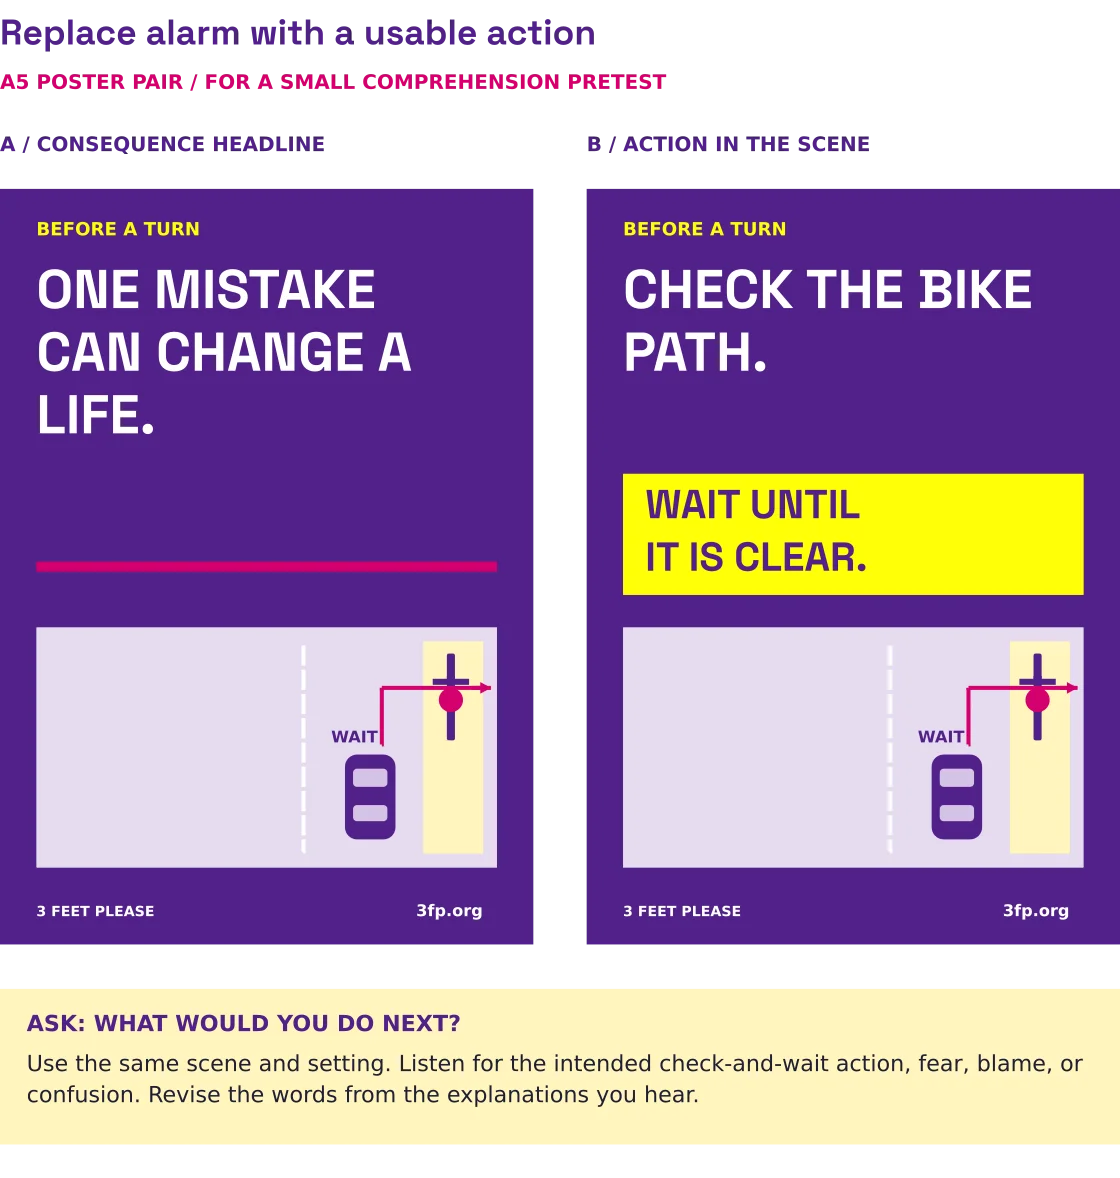
Figure 9. Turn emotion into a usable action. Ask viewers what they would do next and whether the message makes riding feel more or less welcoming.Print example 5. Replace alarm with a usable action. Use the pair to find out what readers understand and feel. Fear-appeal evidence motivates checking both the intended response and possible harm. Use the explanations to improve the draft. R35, R28.
Compare art styles with the audience
Compare two styles using the same safety instruction. Ask people to explain the action and the road situation, then check which version is easier to understand and remember. Use the results to choose the design.
Use an acronym to organize steps people need to remember. Preserve accuracy before memorability. Do not invent a novel sequence that conflicts with an established locally used training method merely to fit a brand slogan. Compare comprehension and whether people remember the steps later if the acronym is central to the campaign.
Wider social-norm research reports effects across varied topics, with substantial differences between studies; those averages do not forecast cycling-safety outcomes. In a 2025 experiment with 136 young New South Wales drivers, three norm messages about phone use did not significantly differ in intended phone use. Some recipients interpreted the message describing common behavior in the opposite direction from what its authors intended. This is indirect evidence for cyclist messaging, but a concrete reason to check meaning rather than rely on a preferred norm label. Rhodes, Shulman and McClaran, 2020R30; Gauld, Craft and Stepnik, 2025R03.
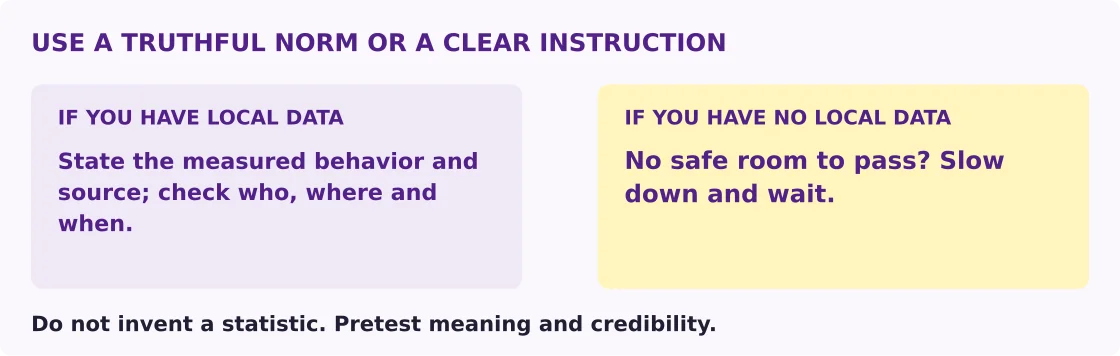
Norm claims must be true and relevant to the intended audience. Do not invent “most drivers give space” or display a high prevalence of unsafe conduct as though normalization is harmless. Test whether a truthful positive norm helps the audience understand and choose the safe action. If no credible local estimate exists, use a clear instruction rather than a fabricated statistic.
A 2026 Norwegian speed campaign evaluation used surveys and measured vehicle speeds. The results were consistent with its positive message about what most drivers do. The study had no comparison group without the campaign, so other changes could also have affected speeds. It offers an example of tracking behavior on the road. Sundfør, Phillips and Aasvik, 2026R58.
Figure 10. Choose a truthful claim. Check the source, population and timing before using a norm. If the data are missing, use a clear action and test its meaning.Print example 6. Use an instruction when local data are absent. This illustrates the choice discussed in the norms section: use an accurate instruction when no relevant local behavior statistic is available. Test the meaning of each step. R30, R03.
08
Rider education and supervised practice
+
Riding skills develop through instruction and practice, and programs can be evaluated by checking what riders learn and can demonstrate. Studies show gains on some knowledge and skill tests; the injury evidence is less clear.
Quick takeaways
Link each reminder to a real lesson or chance to practice.
Check the skill you taught.
Check it again later.
Match the next lesson to the skills riders still need.
Measure learning and injuries
A systematic review of 25 child/youth bicycle-skills studies found no clear evidence that training reduced injuries. Some studies improved knowledge, reported behavior or attitudes, but the programs and measurements varied and many studies had quality limitations. Use learning findings to plan instruction and assess the specific skills taught, while evaluating safety outcomes separately. Richmond et al., 2014R38.
A review of 14 child and adolescent injury studies found that injuries involving motor vehicles were more severe and that lower family socioeconomic status was associated with injury. These observational findings support looking beyond the lesson: ask families about access to suitable practice space, supervision, equipment and safer routes when planning a program. Embree et al., 2016R40.
Training studies should be read at the level of what they assessed: a quiz, hazard video, observed handling task, independent travel, or reported crash. These outcomes have different meaning. Build practice in stages, with supervision and routes matched to the rider's assessed skills.
What learning studies show
An evaluation of Bikeability, a bicycle-training program in England, found higher on-screen hazard-response quiz scores among trained pupils than comparison pupils, with differences retained at a later test. Schools were not randomly assigned. A separate practical assessment involved trained pupils only and showed a decline at a later check; there was no comparison group for that assessment. Include both knowledge and practical skill checks in the training plan. Hodgson and Worth, 2015R05.
A hazard-perception review combined seven cyclist study samples from five papers and found improved performance on video-based hazard tasks. Two studies checked performance again at three weeks and found it remained above the level before training. Results varied considerably across studies, and the cyclist studies assessed hazard skills rather than everyday riding behavior. Use a reviewed video scene to ask what could happen next, discuss the response, and check the skill later. Prabhakharan et al., 2024R33.
The “Safer Cycling in Older Age” (SiFAr) trial assigned participants by chance to a cycling exercise program or health-advice sessions. The cycling program was designed for adults aged 65 or older with relevant riding needs. Participants in the cycling program made fewer errors on a riding course than the health-advice group, including at a check 6-9 months later. Assessors knew which group participants were in; the study measured course performance, not injuries. Consider a structured practice program for older adults with similar riding needs. Keppner et al., 2023R43.
A 2026 review of 46 child/adolescent road-safety education studies reported frequent positive learning and behavioral findings. It covers multiple road-user types. Counting studies with positive results does not tell us the size of an effect or the proportion of children helped. The public abstract reports learning and behavior across several road-user types. Nawaz et al., 2026R18.
An adult classroom-based bicycle education evaluation reported gains in confidence in riding ability, road-rule knowledge and some feelings of safety at a short follow-up, without a detected change in bicycle trip counts. Researchers compared participants before and after training, using people waiting for training as a same-period comparison. Participants were not assigned by chance, some did not complete follow-up, and outcomes were self-reported. A review of nine school-based cycling-to-school interventions rated all included studies weak; its main outcomes concerned travel and factors such as confidence and attitudes rather than injury. These studies support measuring learning and participation as distinct goals, not treating either as proof of safer traffic encounters. Nachman and Rodriguez, 2023R55; Schönbach et al., 2020R56.
A community program in Pelotas, Brazil, offered education, safety equipment and brake checks to 1,133 male bicycle commuters. After adjustment for time, the study found no statistically significant protective effect on reported crashes or near-crashes; about 45% did not attend the intervention. Plan around the audience's work schedules and access needs, record attendance, and consider road and traffic conditions alongside the program. Bacchieri et al., 2010R66.
An educational asset should lead to real instruction
Give a specific next step: a supervised practice opportunity, an accessible training course, help with bike fit, or a route discussion. Confirm capacity and eligibility before advertising it. Use a card to cue a discussion or recap instruction, and connect it to an instructor or mechanic for hands-on help.
For children, account for development, supervision, route conditions and caregivers' resources. For adults, avoid assuming that confidence equals competence or that all people can use the same riding position, bicycle or controls. Make room for adapted cycles, language needs and physical limitations. These are delivery and inclusion recommendations, rather than effect estimates from a single educational trial.
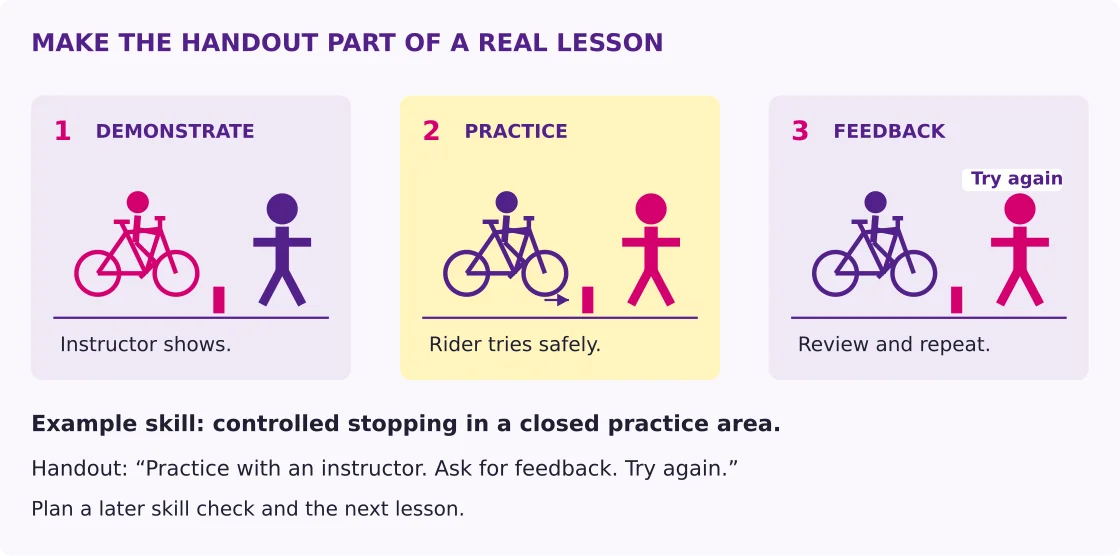
Practice should have a defined task and feedback: for example, controlled stopping or looking while maintaining a line, in a suitable closed setting with qualified supervision. Select techniques through an established local training standard. Do not encourage unqualified volunteers to conduct live-traffic instruction outside their competence.
Put this into practice: Record the handling skills taught, give feedback, and check those skills again later. Ask how much participants are riding and what further help they need.
Figure 11. Build the card around the lesson. Show the skill taught, the safe place to practice, and where to get feedback. A take-home reminder can point to the next session.Print example 7. Make a handout part of a real lesson. Distribute the card through an existing supervised program. The studies support assessing specific skills and follow-up; the card is an example of connecting print to that work. R05, R38, R55.
09
Lights, visibility and helmets: separate advice, access and effect
+
Equipment messages are most useful when people can obtain, fit, and use the equipment. The studies in this section measure different outcomes, from detection and wearing to injuries, and those results should guide the advice you give.
Quick takeaways
Show how to use the gear.
Offer help with fit and cost when you can.
Check whether people use it.
Use injury data to judge claims about fewer injuries.
Show how visibility equipment works in real conditions
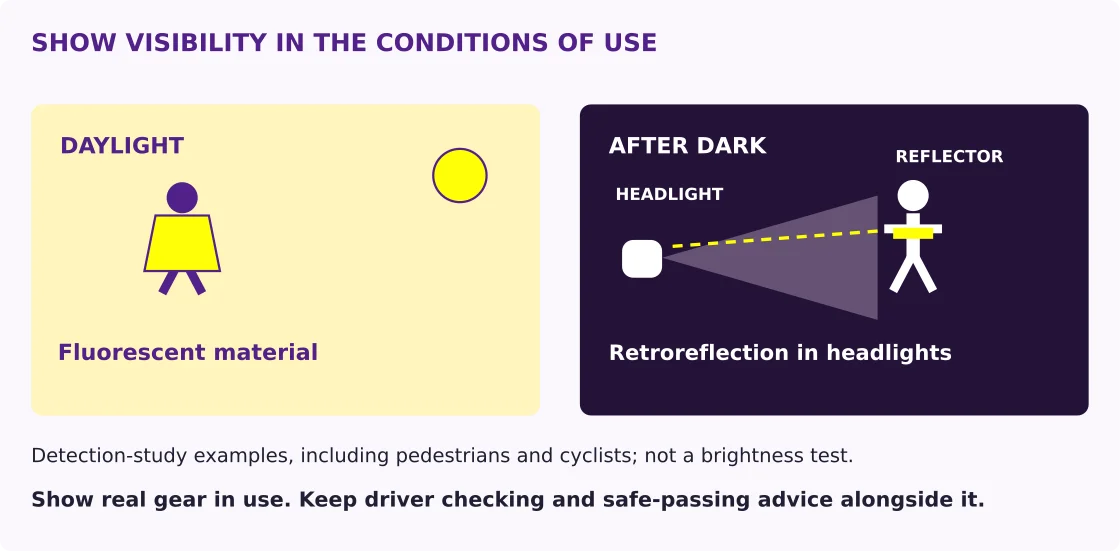
Visibility-aid research has often measured detection and recognition under experimental conditions. In the reviewed detection studies, fluorescent materials, which appear especially bright in daylight, helped during the day. At night, lamps and retroreflective materials, which return light toward its source, helped drivers see people. The studies included both pedestrians and cyclists. Show daytime and night-time uses separately, demonstrate equipment in the conditions where it will be used, and pair visibility advice with driver checks and safe passing instructions. Kwan and Mapstone, 2006R20.
Figure 12. Show the conditions that matter. These are mechanism illustrations based on the mixed pedestrian/cyclist detection literature, not measured brightness or injury effects. Demonstrate the actual equipment in relevant conditions. Source: Kwan and Mapstone, R20, cited above.
Use equipment studies to choose the advice, then test how well the campaign teaches correct use. At an event, demonstrate the light, help riders fit and aim it, and ask each rider to show how to check and charge it.
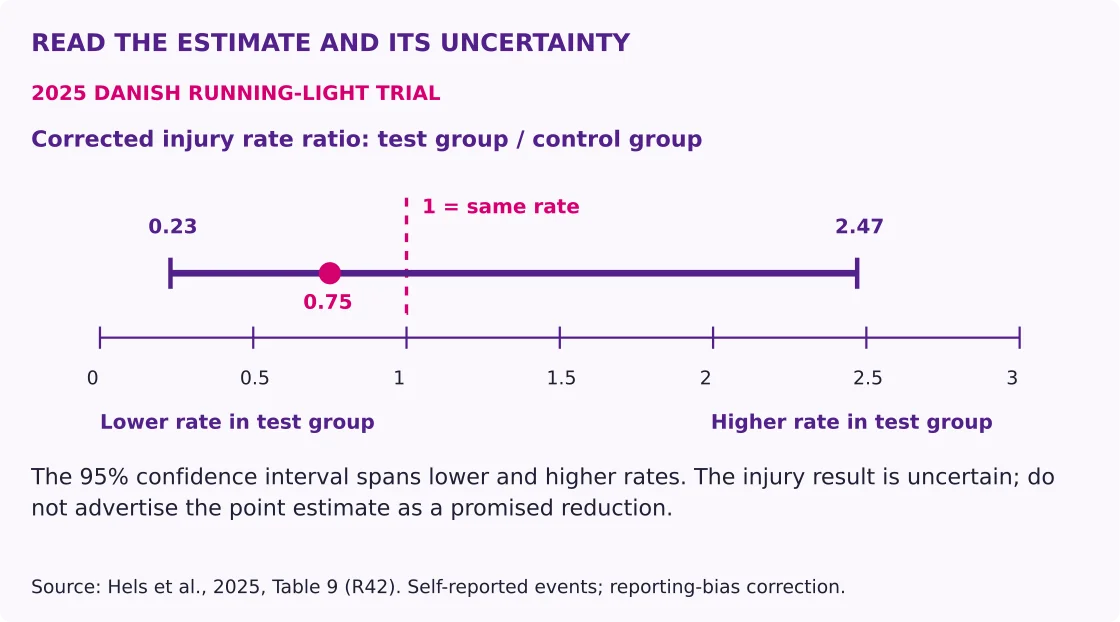
A 2013 Danish equipment trial reported fewer self-reported personal-injury accidents with permanent running lights. A newer study assigned 5,380 cyclists by chance to a light group or a comparison group; 3,592 submitted at least one monthly survey. Its corrected estimate for injury crashes involving another road user was uncertain: the incidence-rate ratio (IRR) was .75, with a 95% confidence interval of .23-2.47. The ratio compares the injury rate in the light group with the rate in the comparison group; 1 means the rates are equal. A separate finding for riding after dark covered all crashes involving another road user, including crashes without injury. Withdrawals differed (301 in the light group versus 61 in the comparison group), 640 never answered a survey, and rates used months of survey participation rather than riding distance. Participants knew which group they were in and reported their own crashes; the wide interval adds uncertainty. Neither trial tested a campaign message. Madsen et al., 2013R21; Hels et al., 2025R42.
Figure 13. Explain an uncertain estimate visually. The dot is the estimate and the line is its 95% confidence interval for injury crashes involving another road user. A ratio of 1 means equal rates. The wide interval spans lower and higher rates; it is not a guaranteed range for an individual rider. Source: Hels et al. (2025), Table 9, R42.
A trial of bright yellow jackets reported fewer self-reported injuries after the researchers adjusted for possible differences in reporting. The result depends on the assumptions used in that adjustment and comes from volunteer riders; different visibility products and conditions need separate evaluation. Fluorescent color, retroreflection and active lights operate differently under different conditions. Lahrmann et al., 2018R16.
Practical light messages
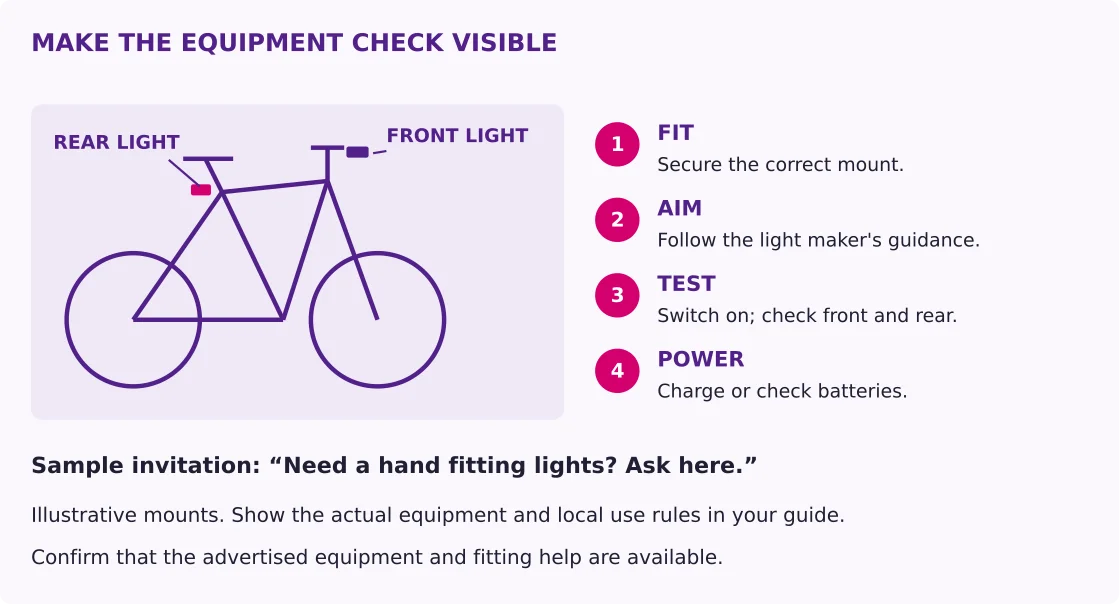
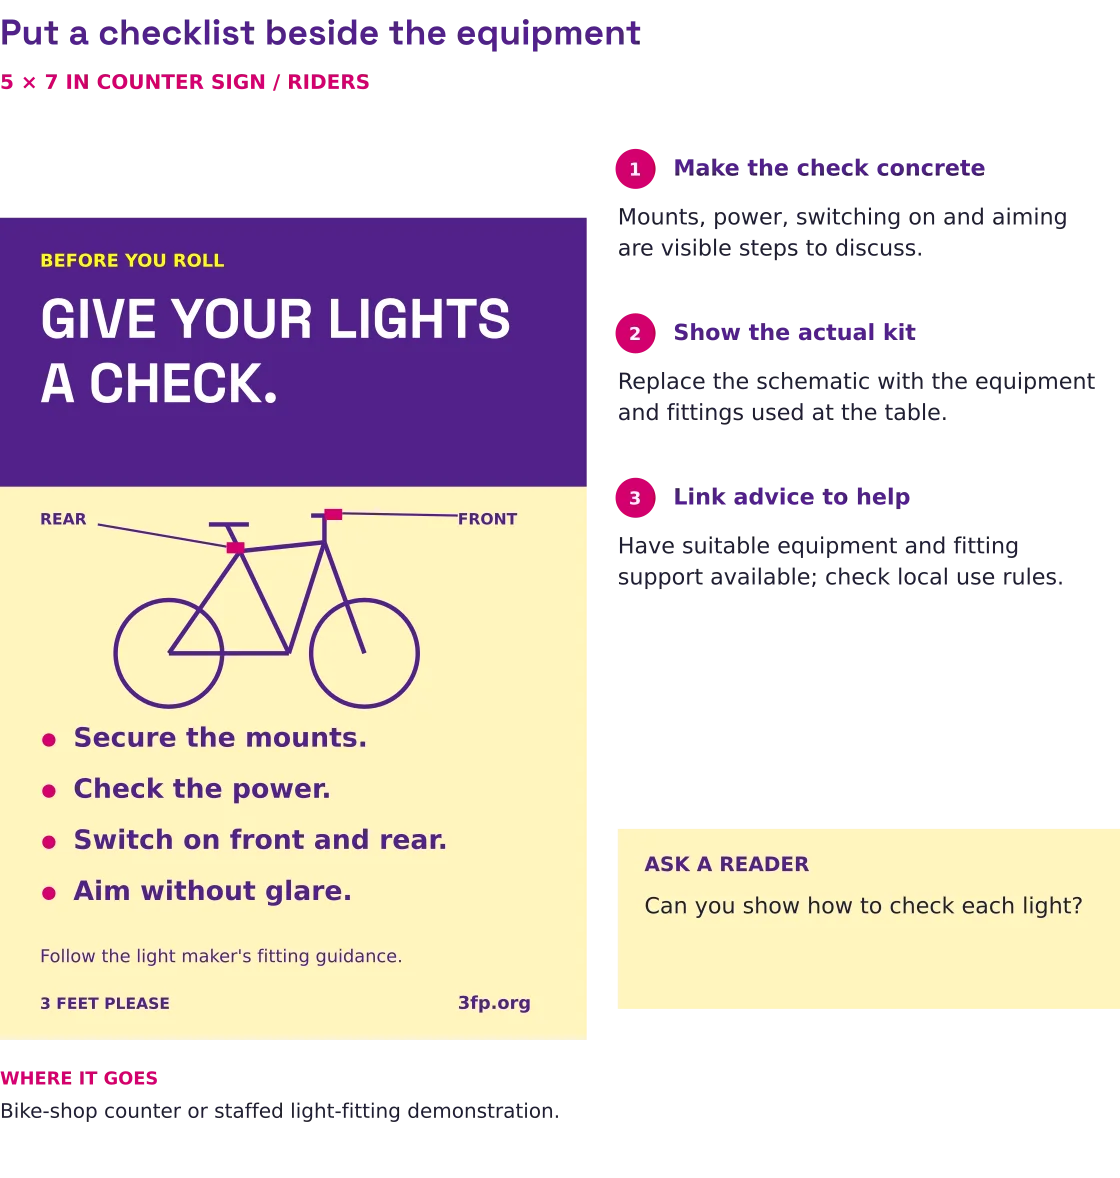
Teach fitting, secure attachment, appropriate front/rear use, charge or battery checks, and aiming without glare. Consult applicable light, reflector and flashing-light rules. Provide fitting help or affordable access when possible, and confirm that the service exists. Provide mounting options for different cycles and a direct way to obtain fitting help.
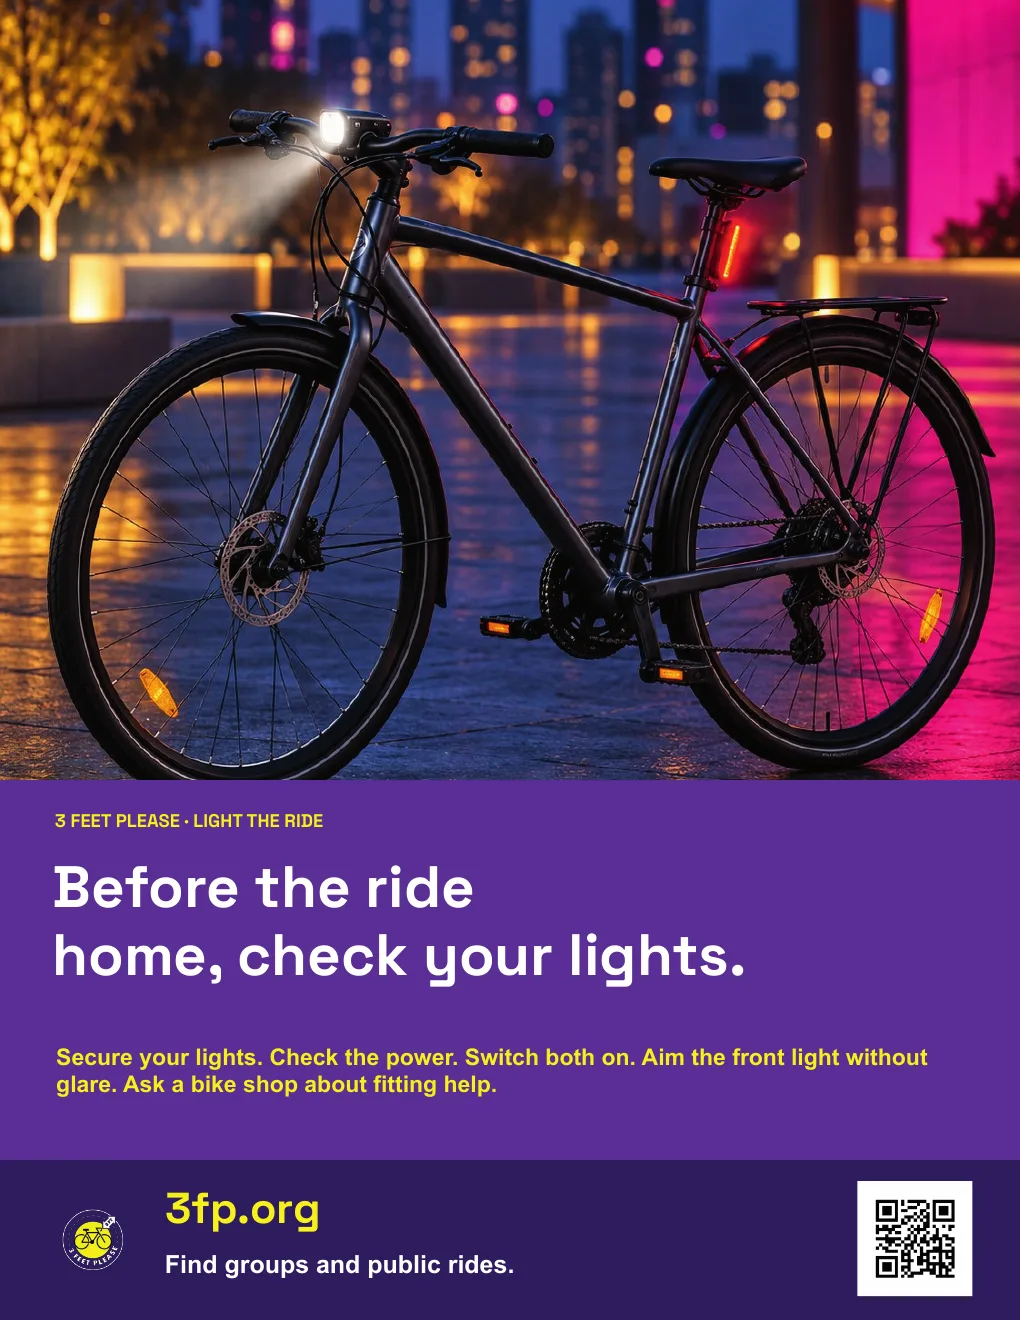
Figure 14. Make equipment advice visible. Photograph or illustrate the actual mounts you teach. Pair the guide with fitting help, and check that riders can perform the steps.Print example 8. Put a checklist beside the equipment. Use this as a prompt during fitting, then replace the schematic with the actual equipment. The visibility evidence concerns seeing equipment under specific conditions. Demonstrate the checks with the actual lights and fitting instructions. R20, R67.
Check helmet use and injury outcomes
Among cyclists who had crashed or fallen, a meta-analysis of observational studies associated helmet use with lower odds of head injury and serious head injury. Use this evidence to explain the purpose of a helmet and encourage correct fit and use. To plan how to increase wearing, turn to the promotion studies below, which tested education, provision, subsidy or community action. Olivier and Creighton, 2017R24; Owen et al., 2011R32.
A review by Cochrane, an independent research network, included 29 studies of child helmet-promotion programs that did not involve a helmet law. Across 11 studies, observed helmet wearing was more common in the groups offered a program (odds ratio, or OR, 2.08; 95% confidence interval: 1.29-3.34). Odds compare the number of people with an outcome to the number without it. An odds ratio compares those odds across groups; it is not a percentage-point increase. The studies used different designs and had varied results. When the review looked only at three trials that assigned participants by chance, the estimate was uncertain (OR .99; 95% CI .18-5.63). Results were larger in studies of community programs and free helmets, but those program types were not compared by random assignment. Some programs increased observed helmet wearing. Use these findings to plan access and fitting support, and measure observed wearing. Owen et al., 2011R32.
A 2023 meta-analysis of eight helmet mass-media articles reported higher wearing, but the results differed greatly across studies (I-squared 99.9%, a measure of variation beyond chance) and the combined estimate had a very wide interval, making its size unsuitable as a planning forecast. Its measured outcome was helmet wearing. Lankarani et al., 2023R26.
In a school trial, groups of schools received the same education pack and free-helmet order form; some schools also received an assembly, lesson and event invitation. It found no clear wearing difference between arms, and was not a leaflet-alone versus no-support test. Another trial, involving 377 children who walked or cycled, found that free visibility aids plus education increased observed use of any visibility aid for up to eight weeks, without measuring injuries. Offer equipment access as part of the lesson and record which activities participants receive. Kendrick et al., 2004R11; Mulvaney et al., 2006R04.
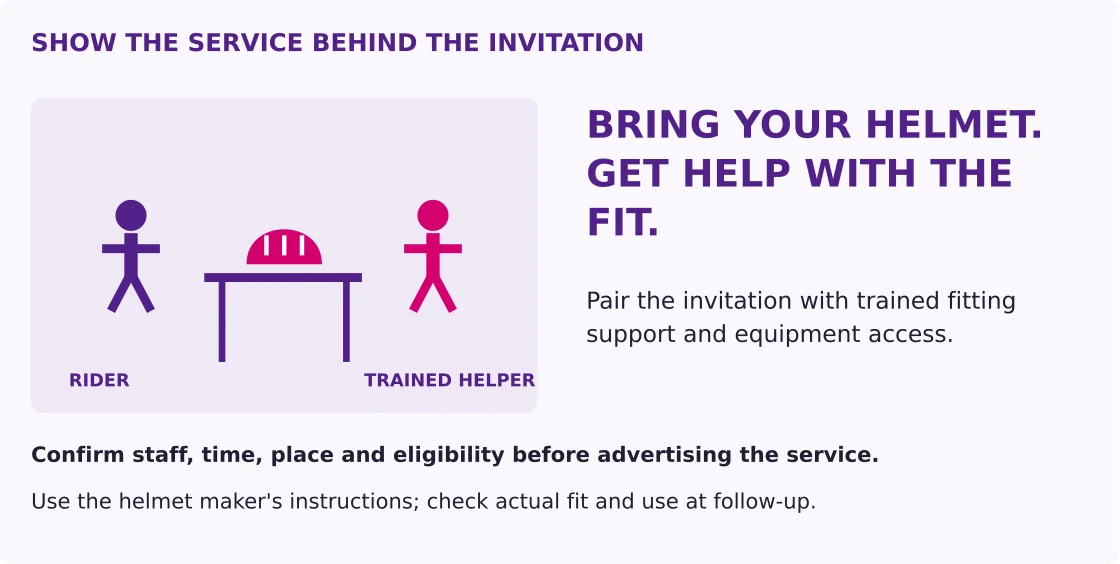
Do not frame a helmet as complete protection, treat wearing as evidence of correct fit, or use it to excuse dangerous driving or road design. If cost or fit is a barrier, information alone may be inadequate. Monitor uptake and participation separately; avoid inferring that a change in observed wearing automatically forecasts a specified reduction in all cyclist injuries.
Figure 15. Advertise help people can use. A fitting invitation connects a reminder to a service. Confirm staff capacity, equipment access and the way participants will obtain help.
10
Campaigns inside larger safety programs
+
Campaigns often combine messages with road changes, training, equipment, or enforcement. Evaluations of these combined programs can inform investment and delivery, especially when partners record what each part of the program provides.
Quick takeaways
Plan messages with safer roads, speeds, and real support.
Measure the whole program.
Track how each part of the program is delivered.
Check what the whole program included
A meta-analysis extracted 119 crash-effect estimates from 67 road-safety campaign evaluations published across 12 countries between 1975 and 2007. Its pooled average was about 9% fewer crashes (95% interval roughly 6%-12% fewer) after adjusting for differences between studies and the possibility that studies with positive results are more likely to be published. Campaigns often included several activities, the evaluations varied in quality, and the authors did not adjust estimates for study quality. Associations of personal communication, roadside delivery or enforcement with larger effects came from nonrandom comparisons of campaign features. The pooled estimate covers general road-safety programs with varied activities. Phillips, Ulleberg and Vaa, 2011R36.
A later systematic review of crash-prevention communication campaigns retained 27 evaluations from 613 screened records: 24 observational or other nonexperimental studies, two experiments and one study combining methods. Observational studies examine what happened without assigning people to receive a campaign. The authors summarized the findings in words and did not formally rate study quality. Audiences, activities and measured outcomes varied across the evaluations. A broader overview of systematic reviews summarizes overlapping road-safety interventions rather than adding independent trials of a cycling poster. Together these sources reinforce the need for evaluation, while their overlap prevents treating each review as a separate confirmation of the 2011 pooled estimate. Faus et al., 2021R51; Fisa et al., 2022R52.
A review of drink-driving campaigns found little overall difference in injuries and deaths across seven studies (relative risk, or RR, 1.00; 95% CI .94-1.06). Relative risk compares the probability of an outcome between groups; 1 means the probabilities are equal. This result concerns drink-driving campaigns and shows why each program needs evaluation. Yadav and Kobayashi, 2015R46.
Watch for Me NC combined outreach, education, enforcement and engineering changes at some locations. Its evaluation found different bicycle-crash results depending on how researchers accounted for the amount of cycling, so the effect on bicycle crashes remained uncertain. The evaluation also could not determine the contribution of each program component. Saleem et al., 2018R37.
A Texas Safe Routes to School evaluation concerned combined pedestrian/bicyclist injuries and a multifaceted program. The authors cautioned that the observed decline could not be causally attributed to the program because injury rates were already falling and other changes over time could not be separated adequately. The program combined several activities. DiMaggio, Brady and Li, 2015R13.
Reach drivers through instruction and workplace routines
A national NHTSA review of education materials examined state curriculum guidelines, driver manuals and training resources. Manuals tended to emphasize rules over safe-driving practices; many training resources omitted newer facilities such as bike boxes. Use these findings to check a partner's lessons: show how to pass, check before turning, look before opening a door, and respond to the bicycle facilities drivers will meet locally. Calderón et al., 2024R68.
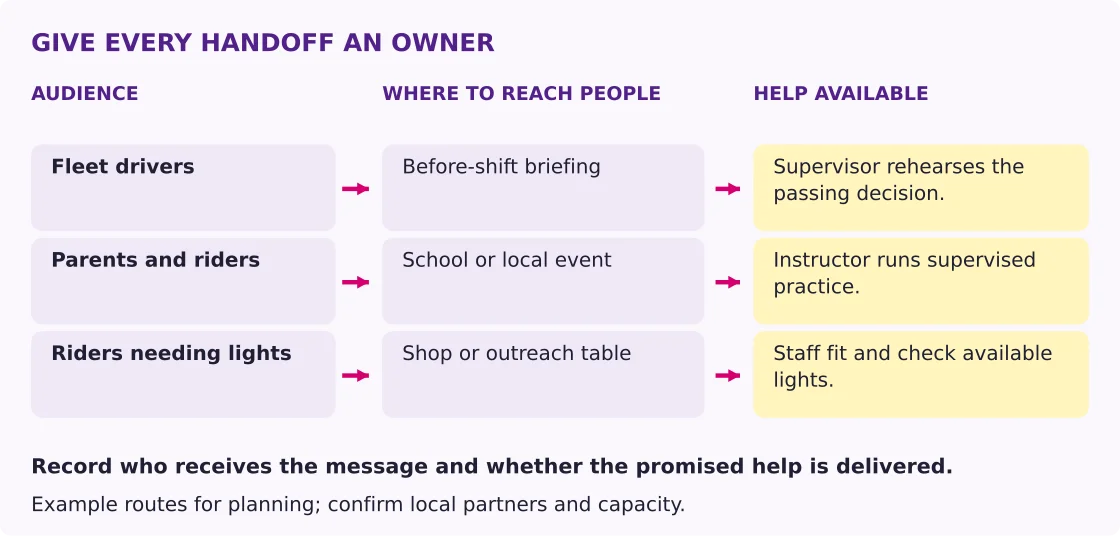
For a fleet or driving-school partner, build one short discussion around a local scene. Ask the instructor to explain the safe decision, let participants describe it back, and schedule a later reminder. Agree on who delivers the lesson and how completion and understanding will be recorded.
Figure 16. Plan the route to the audience. Choose a setting people already use, name the partner, and record what help is delivered. Review reach among people outside existing cycling groups.
What this means for investment
Use messaging to explain and support a concrete safety change: how to use a redesigned junction, what a passing rule requires, where training is available, or how to obtain and maintain equipment. Do not divert necessary engineering or speed-management work into publicity on the assumption that awareness can compensate for unsafe conditions.
Plan delivery as seriously as creative work. Identify the audience, location, frequency, responsible partner, accessible format and available support. Reach people who do not already belong to a cycling organization. Maintain current service and legal information. Resource assessment, audience research, implementation and evaluation are explicit elements of official campaign-planning guidance. World Health Organization, 2016R44.
A rapid evidence review prepared for the UK Department for Transport by the National Centre for Social Research (NatCen) puts education beside road design, rules, enforcement and equipment when reviewing cycling and walking safety. That is useful context for deciding whether a communication campaign addresses the actual constraint. Use the assessment to match the intervention to the local problem: road layout, speeds, equipment, skills, or understanding. DfT/NatCen, 2020R50.
11
A practical brief for organizations and creative teams
+
A strong brief turns research into a specific audience, road situation, action, and delivery plan. Use the questions and examples here to prepare a design that can be checked with the people who will see it.
Quick takeaways
Name the audience and road situation.
Choose one safe action and find out what gets in the way.
Plan the help people need and where to reach them.
Test the words and picture with the people who will see them.
Use the following brief before approving a design. Use it to agree on the goal, delivery plan, and evaluation before layout begins.
Brief question
What a usable answer contains
Who needs to act?
A defined audience reached through a credible channel
At what moment?
A recognizable situation, with a safe opportunity to use the advice
What should they do?
One observable action, accurately described
Why might they not do it now?
A locally investigated barrier, not an assumption about ignorance
What makes the action feasible?
Skills, equipment, supervision, road conditions or organizational support
What evidence supports the approach?
What was tested, what was measured, and the study limits
What could go wrong?
Misinterpretation, blame, fear, inaccessible advice or displaced risk
What will be measured?
The main result, comparison, later check, and how it will guide a decision
Start with a behavior and a barrier
Write one sentence specifying the actor, encounter, action and context. Then name the suspected barrier and what evidence supports that diagnosis. “Raise awareness of cyclists” is too vague to define success. “Improve drivers' understanding of why a rider may need to leave the curb” is a testable communication objective; “increase safe passing clearance” is a separate behavioral objective.
Before approving copy, compare it with current safety evidence and local guidance. A review of 48 Canadian driver and cyclist education materials found advice that conflicted with or omitted relevant cycling-safety evidence. Have a qualified local reviewer check road rules, diagrams, and riding advice before printing. Winters, Weddell and Teschke, 2013R54.
Adapt and test the sample messages
The examples below illustrate clarity and feasibility. Check law, traffic direction, translation and the depicted scene before use.
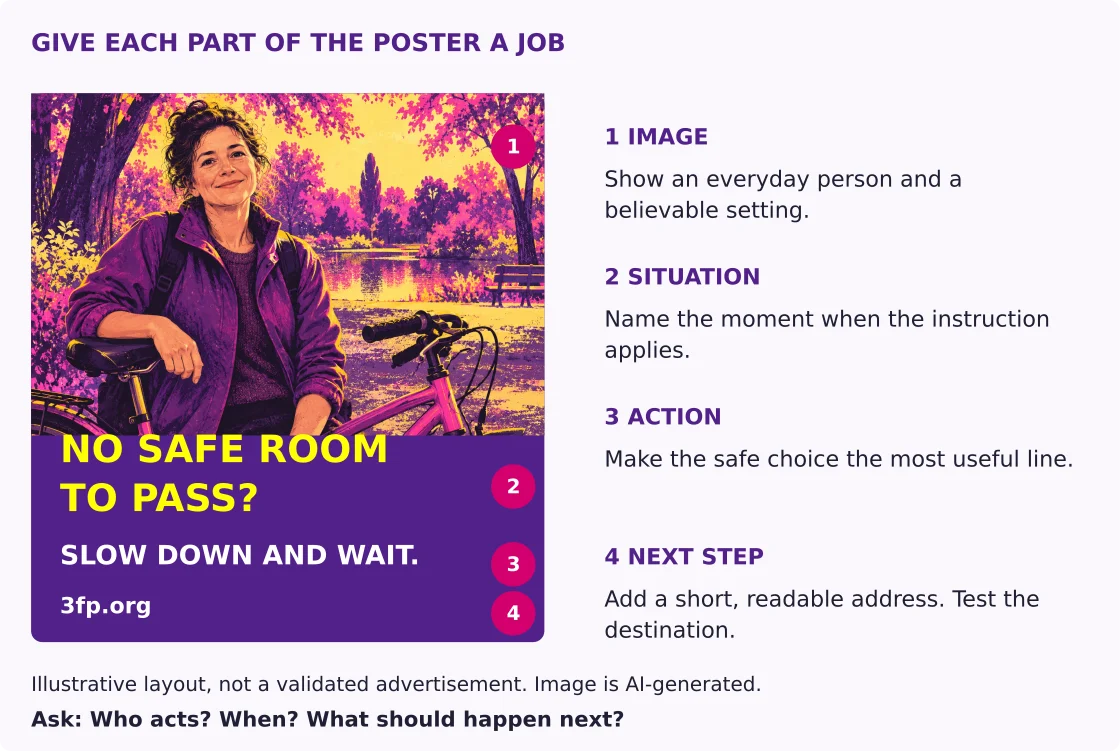
Figure 17. Make every element earn its space. Use this structure to review a draft: can viewers find the situation and action before being distracted by the image or brand? This is an illustrative 3fp.org layout; use your own organization and a relevant destination when adapting it.
Passing: “No safe room to pass? Slow down and wait behind.” Check that the audience does not interpret the scene as an invitation to squeeze through.
Lane position: “Rough edges can put a rider farther from the curb. Give room and wait for a safe pass.” Check understanding of the hazard and the driver's response.
Door opening: “Before opening, check beside and behind. Open only when clear.” A parked demonstration can support the prompt; do not demonstrate into live traffic.
Turning: “Before turning across a rider's path, check and wait until the rider has cleared.” Show the actual relevant encounter accurately.
Practice: “Build the skill before the traffic. Find supervised instruction.” Only advertise a service or provider that can deliver it.
Lights: “Need help fitting lights? Ask about available support.” Connect the invitation to real equipment and fitting access, with accurate local use advice.
Compare creative options fairly
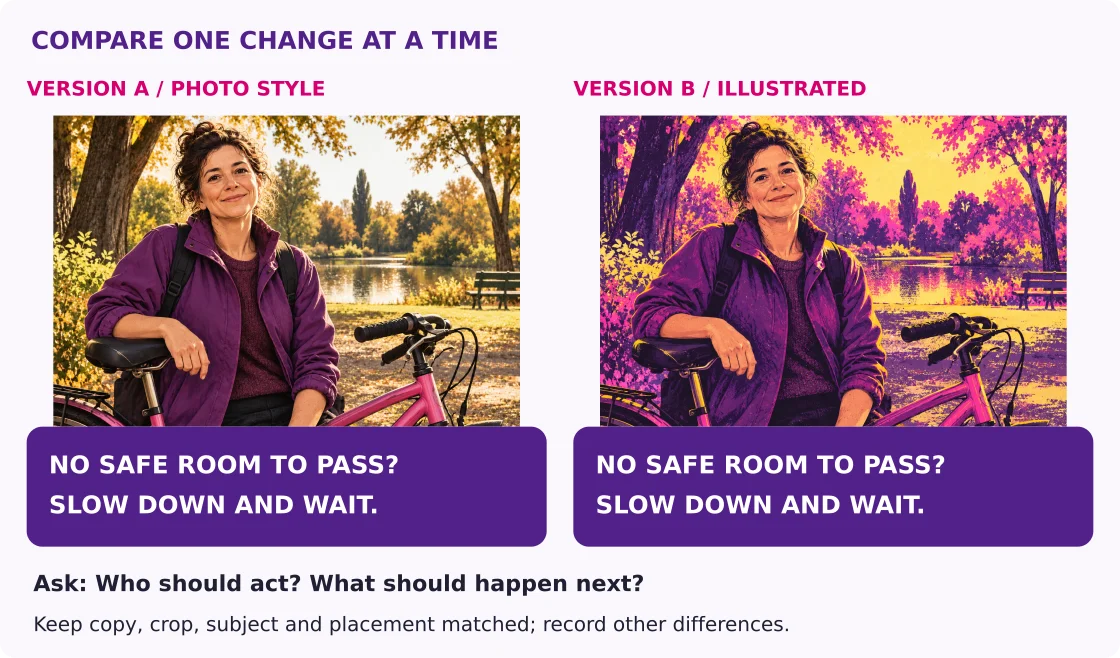
Figure 18. Compare two image choices. These AI-generated images illustrate two visual directions. Match the subject, crop, wording and layout, note any remaining differences, and ask the same questions of both versions.
To compare images, keep copy, layout, placement, timing and audience allocation constant. To compare wording, hold the other important elements steady. If everything changes, the result can compare complete packages but cannot identify which element caused the difference. Randomize exposure where feasible, or explain the limits of a nonrandom comparison.
Pretest with intended recipients, including people who do not ride and people whose language, literacy or access needs differ from the design team's. Ask them to explain what they would do next without prompting. Include deliberately ambiguous scenes to identify unsafe interpretations. Use small sessions to find confusing wording and unsafe interpretations, then revise and test again.
The CAST manual recommends checking clarity, suitability and appeal with the intended audience before release. The National Academies vulnerable-road-user toolkit offers audience, channel and campaign-planning tools. Use these tools to structure audience interviews and compare draft materials. CAST manual, Part II, 2009R47; National Academies, 2023R63.
Use pictures to explain the task
A review of health communication research found that pictures paired closely with simple words can help attention, recall and understanding. Clear diagrams are useful for showing order and spatial relationships. This evidence comes from health and education settings, so use it as a design basis and test the cycling example with the intended audience. Involve intended users when creating or selecting pictures, put a plain caption beside the relevant action to guide interpretation, and compare what people understand with and without the picture. Houts et al., 2006R67.
Use a sequence for a door check, a road schematic for a turning conflict, and a fitting photo for equipment. A portrait can create recognition; the instruction should still be easy to find. Ask a subject-matter reviewer to check the scene before audience testing.
Maintain dignity and accessibility
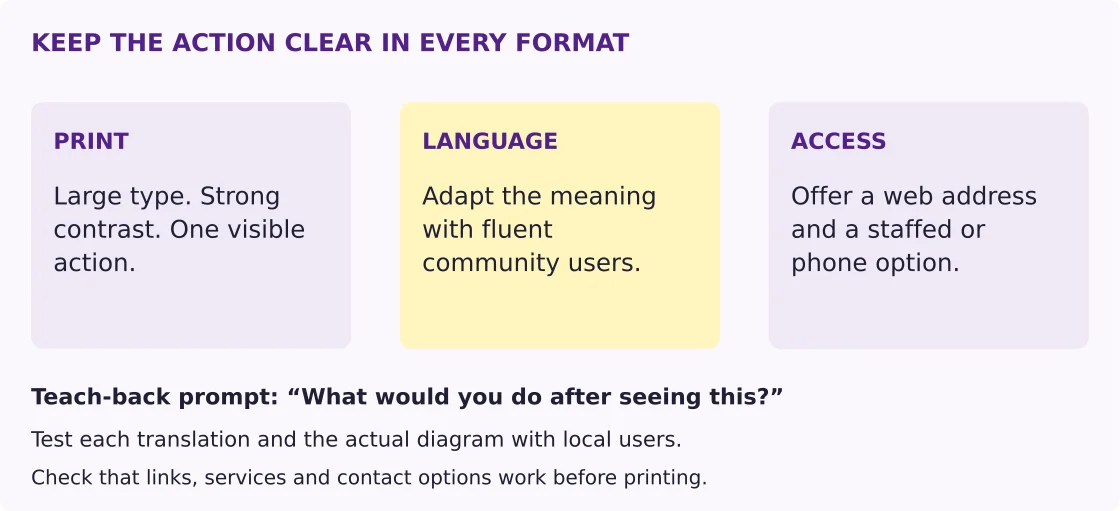
Use legible type, contrast, plain language and accurately drawn road situations. Describe images for screen readers and offer a web address or other way to get information without scanning a QR code. Translate the meaning and test it with fluent local users. Do not assume that a literal translation, a familiar gesture, or a traffic diagram transfers across countries. These steps help make materials clear and accessible.
Figure 19. Check the real format. Print a sample at its intended size, test each translation, and ask users to explain the next action. Give people a working way to get help.
Example: a small passing campaign
A local group hears that drivers are unsure when they can pass on a narrow road. The group checks local rules and talks with riders and drivers. It drafts “No safe room to pass? Slow down and wait behind,” pairs the message with a locally reviewed explanation, and asks a driving instructor to demonstrate the decision in a safe setting. The group pretests the draft with people who drive, arranges displays where drivers can see them while parked, and records where materials are placed.
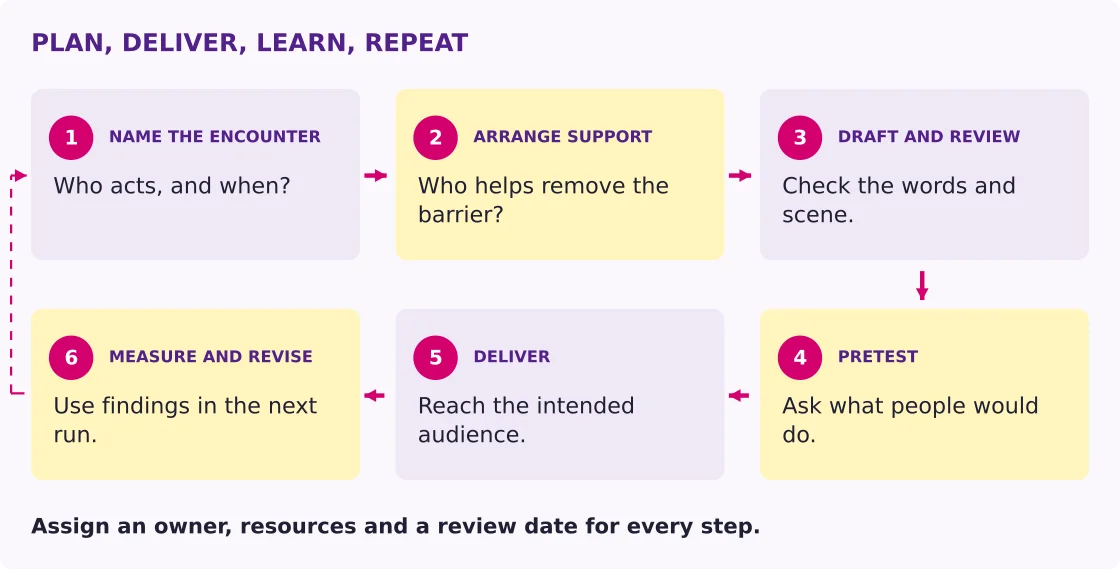
To start evaluation, ask a small set of drivers to explain the action in their own words before and after viewing the draft. Record confusion and revise the copy. If the goal is to measure actual passing, work with qualified partners on a safe observation plan and a comparison. This example illustrates a plan; it is not a tested campaign result.
12
Evaluate what the campaign is supposed to change
+
Evaluation helps a team find out whether a campaign reached people, was understood, and supported the intended action. Choose measures and a comparison that fit the goal, then use the results to improve the next campaign.
Quick takeaways
Pick the main change you want to measure.
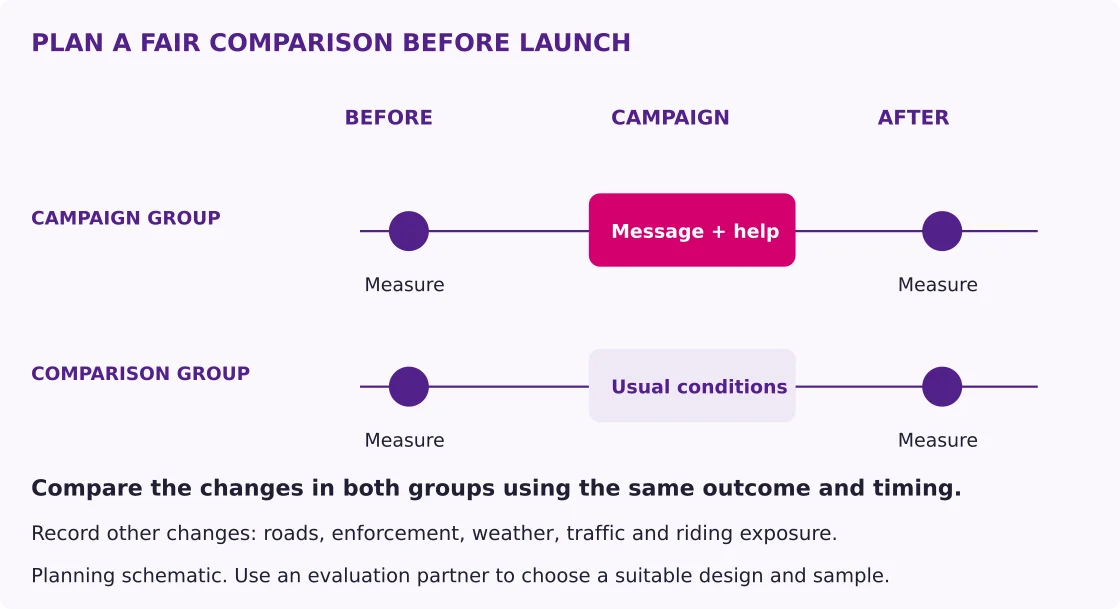
Plan a fair way to compare results.
Track who sees and understands the message.
Track actions, injuries, riding, and possible harm too.
Build a short chain of expected effects
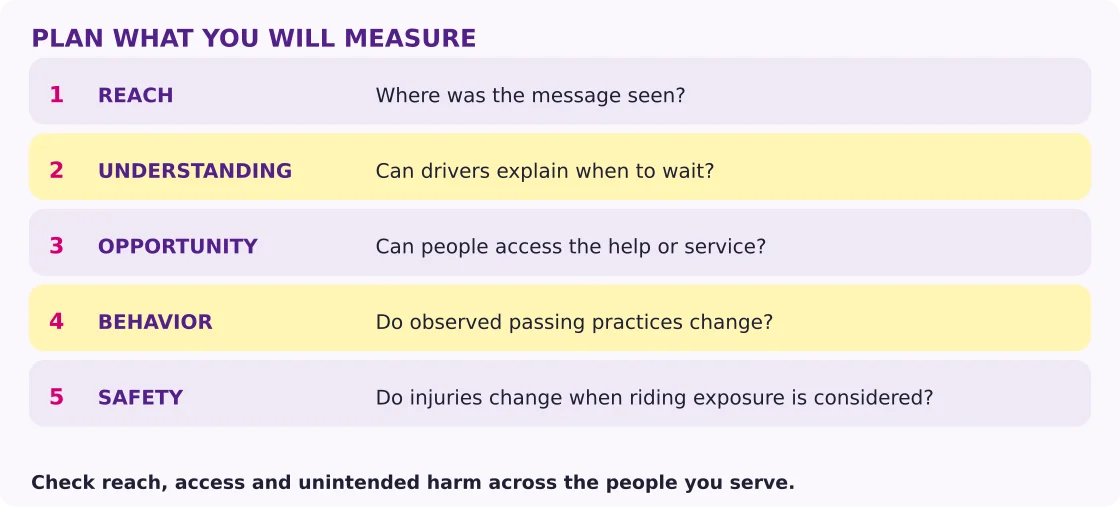
Specify exposure, understanding, capability/opportunity, behavior and safety outcome separately. A campaign can fail because people never encounter it, misunderstand it, lack the means to act, or do not sustain the behavior. Measuring only the final link misses useful explanations; measuring only the first link invites overclaiming. Context and implementation are central to evaluation of complex interventions. Skivington et al., 2021R39.
Figure 20. Match measures to the campaign. Choose measures that fit the goal and resources. The sequence is a planning model, and each step needs its own evidence.
A useful evaluation can be modest and honest. If resources only support comprehension work, do that well and describe it as comprehension work. If the program aims to change passing, seek qualified partners and a safe protocol for objective behavior measurement. Do not manufacture hazardous encounters or expose volunteers to close passes for research.
The National Academies' 2025 campaign-evaluation guide and companion methods report offer a practical menu of focus groups, surveys, media measures, observation, naturalistic road data and crash analysis, with cost and resource considerations. Read them together for planning and measurement methods. The older CAST manual also separates process, outcome and economic evaluation. For a small organization, start by recording placement and asking people to explain the action. Report the number reached, the questions asked, and the number who understood. Use the findings to revise the material. National Academies evaluation guide, 2025R48; companion methods report, 2025R49; CAST manual, 2009R47.
Match the question to a design
Evaluation question
Suitable approach
What to record
Did the intended audience encounter it?
Records of where materials were placed and whether people saw them
Audience reached, setting, date and actual exposure
Did people understand the action?
Assign versions by chance or ask people to explain the message
Answers in the audience's own words and any errors
Did actual behavior change?
Observe behavior before and after, with a suitable comparison group
Results before and after, road conditions, and a later check
Did equipment use or skill persist?
Repeat the same fit, function, or skill checks later
Fit, function and skill checks at the start and later
Did collision or injury risk change?
Work with researchers on a comparison large enough to detect change
Crashes and injuries, amount of riding, and reporting changes
Did it cause harm or widen inequity?
Check blame, fear, participation, and who was reached
Results by language, access needs, location and participation
Choose the main result to measure before launch. Decide who or what will be studied, who qualifies, when measurements will happen, and what change would justify the next step. Ask an evaluation partner to set the sample size using the starting outcome, the change you need to detect, how participants are grouped, and expected loss to follow-up.
Figure 21. Measure change against a comparison. The diagram illustrates a controlled before/after design, with no invented results. An evaluation partner should consider differences between groups, how groups are chosen, whether the comparison group also sees the campaign, and other changes over time. Use the evaluation guidance cited in this section to choose a design that fits the campaign.
For passing studies, traffic, road width, speed, rider position and time of day can affect encounters. For injury studies, record riding exposure and changes in reporting. For school programs, developmental change and family resources may differ between groups. For observational media evaluations, seasonality and concurrent policies can imitate an intervention effect.
For social posts, impressions, views, shares and QR scans measure delivery or engagement. A systematic review found only eight eligible studies on social-media exposure and road-rule violations, with only one exploring potential driving-behavior impact. Use reach data to check distribution, then add interviews or observation to assess understanding and behavior. Stefanidis et al., 2022R53.
In a small early test, ask why people misunderstood the message and use their answers to revise it. A difference between two small groups, such as the invented counts below, is not enough to declare one version a clear winner.
Figure 22. Report a small pretest clearly. The counts in this example are invented for teaching. Use your actual counts, recruitment and question, then explain what you changed and what you will test next.
Report what changed and what you measured
Report counts with the total number studied, such as “6 of 10 drivers.” Include confidence intervals where appropriate; explain how people were recruited, how many did not complete the study, whether the campaign was delivered as planned, and any harmful or unexpected findings. Identify results discovered after examining smaller groups separately. When the interval is wide and the result is not statistically clear, report the uncertainty and explain what should be checked next.
Keep costs and opportunity costs visible. Report what resources went into design, delivery, training, equipment, enforcement and evaluation. Use pilot results to adjust delivery before expanding. Publish useful null results so other organizations do not repeat the same untested assumption.
13
What to do, what to avoid, what to study next
+
The evidence points to practical steps organizations can take now and questions that need further study. Use this section as a checklist for planning with partners and improving future campaigns.
Quick takeaways
Teach a clear action people can take.
Help people put it into practice.
Test the message before sharing it widely.
Report what changed, who it helped, and what is still unknown.
Do now
Select a specific encounter and actor; give a feasible action and verify the local rules.
Support the action with appropriate instruction, equipment, services, road design or organizational policy.
Use evidence for the outcome actually measured; retain the study limits when sharing a statistic.
Test comprehension and unintended interpretations before wide distribution.
Reach the people whose behavior is meant to change, and assess participation, access and equity.
Keep a dated evidence register and revise the campaign when findings, conditions or services change.
Fix these common campaign problems
Vague advice: replace “be aware” with a clear action at a named moment.
Advice people cannot use: add fitting help, a practice session, affordable gear, or another service that removes the barrier.
Rider blame: show the driver duty and road context alongside rider advice.
A striking image with a buried instruction: make the safe action easy to find and explain.
Low uptake: check where the audience sees the material and whether services fit daily travel, language, and access needs.
A flattering success story: include participation changes, harmful responses, and results that showed little change.
Figure 23. Take the plan to your partners. Assign an owner, timing and resources to each step. Use the findings from one run to improve the next.
Research priorities
The most valuable next studies would compare clearly specified messages in real settings, measure objective encounters safely, and follow participants long enough to assess persistence. Studies that compare different combinations of messages and support could help show which parts contribute to a result. The field also needs more evidence on door and turning prompts, non-English communication, adapted cycles, e-bikes, different traffic systems, lower-resource settings and underserved audiences.
Evaluate mechanisms as well as effects: did a lane-use explanation correct a misconception, did fitting support improve functioning equipment use, or did a human story change only immediate survey ratings? Measure participation and exposure alongside injury. Report costs and negative findings. Study which action changed, who changed it, what support was needed, and how long the change lasted.
Plan research and distribution with equity in view. A U.S. census-tract analysis found that fatality locations shifted toward lower-density areas and were associated with neighborhood socioeconomic differences; these are area-level associations, not individual cyclist risk estimates or evidence about messages. Together with the Bogotá case study, it argues for checking whose roads, languages and travel needs are represented before selecting sites or calling a campaign universal. Ferenchak et al., 2026R62; Torres-Barragán, Cottrill and Beecroft, 2020R61.
REF
References and evidence register
+
The sources below let readers trace the findings to the original studies and guidance. The companion evidence register adds the study design, measured outcomes, access notes, and limits for each source.
Quick takeaways
Find the study behind a recommendation.
Check who took part and what was measured.
Use the evidence register to review study limits.
The linked citations identify the evidence behind each claim. Each citation includes a permanent record ID, such as R15, that links to its reference entry. R17 and R25 are retained as background records; they are not used to support a claim in the main text. The companion evidence register, evidence-matrix.csv, adds how each study was conducted, who took part, what was measured, access restrictions and interpretation limits. It is supplied as a separate file and embedded as a CSV attachment in the PDF edition; attachment support varies by PDF reader. References below include empirical evaluations, syntheses and planning frameworks. Reviews can include overlapping studies; check the register when tracing a finding.
68 source records are indexed. Reviews overlap with primary studies, and some records are methods or guidance rather than effectiveness research. Access labels describe the material available to this review.
R66 | Bacchieri, G.; Barros, A. J. D.; dos Santos, J. V.; Gonçalves, H.; Gigante, D. P. (2010). A community intervention to prevent traffic accidents among bicycle commuters. Original source. Access: Full original journal article PDF.
R34 | Blomberg, R. D.; Wright, T. J.; Van Houten, R.; Finstad, K.; Thomas, F. D. (2022). Evaluating High-Visibility Enforcement of Bicycle Passing Laws. Original source. Access: Full government report and metadata page.
R14 | Box, E. (2025). Highway Code Intervention Evaluation Report. Original source. Access: Full report.
R68 | Calderón, R.; Sheveland, A.; Outman, M.; Sharma, A. (2024). A Nationwide Review of Pedestrian and Bicyclist Safety Education in Driver Education. Original source. Access: Full original NHTSA report DOT HS 813 655; local copy from Pedestrian and Bicycle Information Center; methods pp. 3-4 and discussion pp. 27-28 checked.
R35 | Carey, R. N.; McDermott, D. T.; Sarma, K. M. (2013). The impact of threat appeals on fear arousal and driver behavior: A meta-analysis of experimental research 1990-2011. Original source. Access: Open full text at PLOS ONE and PubMed Central.
R25 | Carlin, J. B.; Taylor, P.; Nolan, T. (1998). School based bicycle safety education and bicycle injuries in children: a case-control study. Original source. Access: Open full-text article PDF and PubMed record.
R06 | Concepts of Change; Ipsos Social Research (2013). Reducing Car Dooring: The role of stickers as visual reminders. Original source. Access: Full report by Concepts of Change with Ipsos Social Research, prepared for Road Safety Action Group Inner Melbourne; evaluates VicRoads stickers.
R07 | Crundall, D.; van Loon, E. (2023). Improving attitudes towards vulnerable road users. Original source. Access: Full evaluation report plus journal abstract.
R08 | Crundall, D.; van Loon, E. (2023). Revisiting attitude change sixteen months after vulnerable road user empathy videos: Look Out For Laura follow-up evaluation. Original source. Access: Full evaluation report.
R65 | Dalton, A.; Sumner, F.; Jones, A. (2020). Digital screen use for a road safety campaign message was not associated with attitudes or knowledge of passers-by: an experimental study. Original source. Access: University repository abstract and author accepted manuscript.
R10 | Delbosc, A.; Naznin, F.; Haslam, N.; Haworth, N. (2019). Dehumanization of cyclists predicts self-reported aggressive behaviour toward them: A pilot study. Original source. Access: Full author manuscript PDF in local collection; abstract and association results checked.
R47 | Delhomme, P.; et al. (eds.) (2009). Manual for Designing, Implementing, and Evaluating Road Safety Communication Campaigns, Part II: Deliverable 3.2b. Original source. Access: Official Vias-hosted full 146-page PDF, also supplied by reader.
R12 | Department for Transport / THINK! (2016). THINK! Cycling Evaluation 2016: Don’t get caught campaign. Original source. Access: Original official evaluation PDF.
R13 | DiMaggio, C.; Brady, J.; Li, G. (2015). Association of the Safe Routes to School program with school-age pedestrian and bicyclist injury risk in Texas. Original source. Access: Open full article.
R48 | Dunn, N.; Greatbatch, R.; Radlbeck, J.; La Rose, C.; Bravo Bueno, J. (2025). Evaluating Traffic Safety Campaigns: A Guide. Original source. Access: Official National Academies page and full report PDF; 152 pp.
R49 | Dunn, N.; Greatbatch, R.; Radlbeck, J.; La Rose, C.; Bravo Bueno, J. (2025). Objectives, Components, and Measures of Effective Traffic Safety Public Awareness and Education Efforts. Original source. Access: Official National Academies page; full Web-Only Document 7 PDF, 150 pp.
R40 | Embree, T. E.; Romanow, N. T. R.; Djerboua, M. S.; Morgunov, N. J.; Bourdeaux, J. J.; Hagel, B. E. (2016). Risk Factors for Bicycling Injuries in Children and Adolescents: A Systematic Review. Original source. Access: Full original journal PDF supplied by reader; abstract, results and discussion checked.
R51 | Faus, M.; Alonso, F.; Fernández, C.; Useche, S. A. (2021). Are Traffic Announcements Really Effective? A Systematic Review of Evaluations of Crash-Prevention Communication Campaigns. Original source. Access: Open publisher full text and local candidate PDF; Safety 7(4):66.
R62 | Ferenchak, N. N.; Sanchez Rodriguez, O.; Losada-Rojas, L. L.; Schneider, R.; Gu, X. (2026). Longitudinal socioeconomic and built environment shifts in US bicyclist fatality locations 2001-2020. Original source. Access: Open publisher full article under Creative Commons license.
R52 | Fisa, R.; Musukuma, M.; Sampa, M.; Musonda, P.; Young, T. (2022). Effects of interventions for preventing road traffic crashes: an overview of systematic reviews. Original source. Access: Open BMC full text and local candidate PDF; 18 pp.
R57 | Gamble, T.; Walker, I.; Laketa, A. (2015). Bicycling campaigns promoting health versus campaigns promoting safety: A randomized controlled online study of ‘dangerization’. Original source. Access: Peer-reviewed manuscript full text from University of Bath; published in Journal of Transport & Health 2(3), 369-378.
R03 | Gauld, C.; Craft, T.; Stepnik, M. (2025). Investigating the efficacy of social norms messages to reduce smartphone use among young drivers. Original source. Access: Open full journal article PDF.
R41 | Goddard, T.; Ralph, K.; Thigpen, C. G.; Iacobucci, E. (2019). Does news coverage of traffic crashes affect perceived blame and preferred solutions? Evidence from an experiment. Original source. Access: Open-access full paper; DOI and publisher record available.
R31 | Haworth, N.; Delbosc, A.; Schramm, A.; Haslam, N. (2024). How might advertising campaigns rehumanize cyclists? Original source. Access: Local author preprint; published journal abstract and full ACT project report. Local preprint is not the final peer-reviewed article.
R42 | Hels, T.; Madsen, T. K. O.; Christensen, M. C.; Tallaksen, A. B.; Lahrmann, H. (2025). The effect on cyclist safety of daytime running lights. Original source. Access: Open full peer-reviewed article and institutional record.
R15 | Hess, G.; Peterson, M. N. (2015). Bicycles May Use Full Lane Signage Communicates U.S. Roadway Rules and Increases Perception of Safety. Original source. Access: Full peer-reviewed open-access article.
R05 | Hodgson, C.; Worth, J. (2015). Research into the impact of Bikeability training on children's ability to perceive and appropriately respond to hazards when cycling on the road. Original source. Access: Full NFER report and appendices available.
R67 | Houts, P. S.; Doak, C. C.; Doak, L. G.; Loscalzo, M. J. (2006). The role of pictures in improving health communication: A review of research on attention, comprehension, recall, and adherence. Original source. Access: Full published article PDF from University of Trieste repository; sections 4 and 8 checked.
R64 | Høye, A.; Fyhri, A.; Bjørnskau, T. (2016). Shared road is double happiness: Evaluation of a Share the Road sign. Original source. Access: Full author manuscript in local research collection.
R19 | Ipsos UK (2022). An evaluation of the ADI Cycle Awareness Pilot. Original source. Access: Full Ipsos UK report dated December 2022 and appendices; published by Department for Transport on GOV.UK on 31 October 2024.
R22 | Kay, J. J.; Savolainen, P. T.; Gates, T. J.; Datta, T. K. (2014). Driver behavior during bicycle passing maneuvers in response to a Share the Road sign treatment. Original source. Access: Full original journal PDF supplied by reader; abstract and field results checked.
R11 | Kendrick, D.; Royal, S. (2004). Cycle helmet ownership and use; a cluster randomised controlled trial in primary school children in deprived areas. Original source. Access: Open full-text trial.
R43 | Keppner, V.; Krumpoch, S.; Kob, R.; Rappl, A.; Sieber, C. C.; Freiberger, E.; Siebentritt, H. M. (2023). Safer cycling in older age (SiFAr): effects of a multi-component cycle training. A randomized controlled trial. Original source. Access: Open full-text randomized trial.
R20 | Kwan, I.; Mapstone, J. (2006). Interventions for increasing pedestrian and cyclist visibility for the prevention of death and injuries. Original source. Access: Open full review and Cochrane summary.
R16 | Lahrmann, H.; Madsen, T. K. O.; Olesen, A. V.; Madsen, J. C. O.; Hels, T. (2018). The effect of a yellow bicycle jacket on cyclist accidents. Original source. Access: Open full-text author/institutional PDF and publisher article page.
R26 | Lankarani, K. B.; Akbari, M.; Razzaghi, A.; Taghi Heydari, S.; Vali, M.; Tabrizi, R.; Sullman, M. J. M. (2023). Mass media campaigns to increase the use of bicycle helmets: A systematic review and meta-analysis. Original source. Access: Publisher/indexed abstract; full article paywalled/not accessed.
R09 | Large, D. R.; Choo, M. C.; Houghton, R. (2018). Validating Dutch Reach: A Preliminary Evaluation of Far-Hand Door Opening and its Impact on Car Drivers’ Head Movements. Original source. Access: Full author-posted conference paper and institutional record.
R60 | Limb, M.; Collyer, S. (2023). The effect of safety attire on perceptions of cyclist dehumanisation. Original source. Access: Full article PDF in research collection; indexed journal record.
R21 | Madsen, J. C. O.; Andersen, T.; Lahrmann, H. S. (2013). Safety effects of permanent running lights for bicycles: A controlled experiment. Original source. Access: Original full journal article PDF supplied by reader; indexed PubMed record.
R01 | McIntyre, A.; Sinclair, J.; Page-Smith, J.; Ziekemijjer, P.; Ellis, N. (2019). Overview and Outcomes of Victoria’s Passing Distance Cycling Safety Public Education Campaign. Original source. Access: Full extended abstract in proceedings; no detailed technical report located.
R29 | Michie, S.; van Stralen, M. M.; West, R. (2011). The behaviour change wheel: A new method for characterising and designing behaviour change interventions. Original source. Access: Open full article.
R02 | Mills, A.; Loskorn, J.; Brady, J.; Duthie, J.; Machemehl, R. (2010). Effects of Bicycles May Use Full Lane Signs on Bicyclist and Motorist Behavior along Multi-Lane Facilities. Original source. Access: Full city-sponsored report.
R04 | Mulvaney, C. A.; Kendrick, D.; Watson, M. C.; Coupland, C. A. C. (2006). Increasing child pedestrian and cyclist visibility: cluster randomised controlled trial. Original source. Access: Full article PDF available.
R55 | Nachman, E. R.; Rodriguez, D. A. (2023). Evaluating the effects of a classroom-based bicycle education intervention on bicycle activity, self-efficacy, personal safety, knowledge, and mode choice. Original source. Access: Open Frontiers full text and local candidate PDF; 16 pp.
R63 | National Academies of Sciences, Engineering, and Medicine (2023). Communicating Safe Behavior Practices to Vulnerable Road Users. Original source. Access: Official National Academies online full text; PDF download requires guest or account access.
R18 | Nawaz, I.; Cuenen, A.; Ahmed, T.; Zeb, A.; Wets, G.; Janssens, D. (2026). Road Safety education for children and adolescents: A systematic review of effectiveness, methods, and challenges. Original source. Access: Publisher article page and abstract; full text paywalled/not accessed.
R24 | Olivier, J.; Creighton, P. (2017). Bicycle injuries and helmet use: a systematic review and meta-analysis. Original source. Access: PubMed abstract and open full-text copy available from author/institutional sources.
R32 | Owen, R.; Kendrick, D.; Mulvaney, C.; Coleman, T.; Royal, S. (2011). Non-legislative interventions for the promotion of cycle helmet wearing by children. Original source. Access: Open full review.
R50 | Phillips, D.; Mohammed, S.; Rantanen, K.; Bury, J.; Sayers, E.; Forsyth, E.; Bertasevicius, V.; Eyers, J. (2020). Cycling and Walking Safety: A rapid evidence assessment for the Department for Transport. Original source. Access: Official GOV.UK record and full NatCen report PDF; 80 pp.
R36 | Phillips, R. O.; Ulleberg, P.; Vaa, T. (2011). Meta-analysis of the effect of road safety campaigns on accidents. Original source. Access: Original full journal article PDF supplied by reader; PubMed record.
R17 | Pless, I. B.; Verreault, R.; Tenina, S. (1989). A case-control study of pedestrian and bicyclist injuries in childhood. Original source. Access: Open full-text article; exact estimate also indexed in article text.
R33 | Prabhakharan, P.; Bennett, J. M.; Hurden, A.; Crundall, D. (2024). The efficacy of hazard perception training and education: A systematic review and meta-analysis. Original source. Access: Original full journal PDF supplied by reader; cyclist results in sections 3.6.1-3.6.2 checked.
R27 | Reymond, L.; Rérat, P. (2026). Blaming Cyclists, Invisibilising Drivers: How Motonormativity Shapes Swiss Media Collision Reports. Original source. Access: Open full article, tables, and data files at Findings.
R30 | Rhodes, N.; Shulman, H. C.; McClaran, N. (2020). Changing norms: A meta-analytic integration of research on social norms appeals. Original source. Access: Author manuscript publicly available; publisher record available.
R38 | Richmond, S. A.; Zhang, Y. J.; Stover, A.; Howard, A.; Macarthur, C. (2014). Prevention of bicycle-related injuries in children and youth: a systematic review of bicycle skills training interventions. Original source. Access: Full original journal PDF supplied by reader; abstract and Results/Discussion checked.
R37 | Saleem, T.; et al. (2018). Crash-based evaluation of the Watch for Me NC program. Original source. Access: Original full government-commissioned report.
R56 | Schönbach, D. M. I.; Altenburg, T. M.; Marques, A.; Chinapaw, M. J. M.; Demetriou, Y. (2020). Strategies and effects of school-based interventions to promote active school transportation by bicycle among children and adolescents: a systematic review. Original source. Access: Open BMC full text and local candidate PDF; 17 pp.
R23 | Sinclair, J.; Nolan, J. (2026). Do minimum passing distance laws for cyclists change driver behaviour? Original source. Access: Local author preprint plus published journal abstract; published abstract used for the 10 cm estimate.
R39 | Skivington, K.; et al. (2021). A new framework for developing and evaluating complex interventions: update of Medical Research Council guidance. Original source. Access: Open full methods article.
R53 | Stefanidis, K. B.; Davey, B.; Truelove, V.; Schiemer, C.; Freeman, J. (2022). Does exposure to social media content influence attitudes towards, and engagement in, road rule violations? A systematic review. Original source. Access: Open PLOS full text and local candidate PDF; 13 pp.
R58 | Sundfør, H. B.; Phillips, R. O.; Aasvik, O. (2026). Evaluation of the Norwegian Public Roads Administration’s campaign ‘Most people follow the speed limit’: A norm-based approach to increasing speed compliance. Original source. Access: Official TØI publication page, English summary PDF, and linked Norwegian report.
R28 | Tannenbaum, M. B.; Hepler, J.; Zimmerman, R. S.; Saul, L.; Jacobs, S.; Wilson, K.; Albarracín, D. (2015). Appealing to fear: A meta-analysis of fear appeal effectiveness and theories. Original source. Access: Open full text at PubMed Central; publisher PDF also publicly available.
R61 | Torres-Barragán, C. A.; Cottrill, C. D.; Beecroft, M. (2020). Spatial inequalities and media representation of cycling safety in Bogotá, Colombia. Original source. Access: Open publisher full article page and indexed TRID record.
R59 | Tyagi, S.; Wragg, N.; Suhendra, F. (2025). That resonated with me: A user-centred approach to understanding young adult vulnerable road users’ road safety campaigns messaging needs - Case study. Original source. Access: Open publisher article page and indexed abstract; no local full-text PDF obtained.
R54 | Winters, M.; Weddell, A.; Teschke, K. (2013). Is Evidence in Practice? Review of Driver and Cyclist Education Materials with Respect to Cycling Safety Evidence. Original source. Access: TRB article full text hosted by UBC; TRR 2387, pp. 35-45.
R44 | World Health Organization (2016). Road Safety Mass Media Campaigns: A Toolkit. Original source. Access: Full original WHO toolkit PDF; 2016 publication, website listing dated 2019.
R45 | World Health Organization (2020). Cyclist safety: an information resource for decision-makers and practitioners. Original source. Access: Full original WHO practitioner-resource PDF; 2020 edition.
R46 | Yadav, R.-P.; Kobayashi, M. (2015). A systematic review: effectiveness of mass media campaigns for reducing alcohol-impaired driving and alcohol-related crashes. Original source. Access: Original open review and indexed abstract.